|
Documenting current species distribution patterns and their association with habitat types is important as a basis for assessing future range shifts in response to climate change or other influences. We used the adaptive local convex hull (a-LoCoH) method to map distribution ranges of 12 ungulate species within the Kruger National Park (KNP) based on locations recorded during aerial surveys (1980–1993). We used log-linear models to identify changes in regional distribution patterns and chi-square tests to determine shifts in habitat occupation over this period. We compared observed patterns with earlier, more subjectively derived distribution maps for these species. Zebra, wildebeest and giraffe distributions shifted towards the far northern section of the KNP, whilst buffalo and kudu showed proportional declines in the north. Sable antelope distribution contracted most in the north, whilst tsessebe, eland and roan antelope distributions showed no shifts. Warthog and waterbuck contracted in the central and northern regions, respectively. The distribution of impala did not change. Compared with earlier distributions, impala, zebra, buffalo, warthog and waterbuck had become less strongly concentrated along rivers. Wildebeest, zebra, sable antelope and tsessebe had become less prevalent in localities west of the central region. Concerning habitat occupation, the majority of grazers showed a concentration on basaltic substrates, whilst sable antelope favoured mopane-dominated woodland and sour bushveld on granite. Buffalo showed no strong preference for any habitats and waterbuck were concentrated along rivers. Although widespread, impala were absent from sections of mopane shrubveld and sandveld. Kudu and giraffe were widespread through most habitats, but with a lesser prevalence in northern mopane-dominated habitats. Documented distribution shifts appeared to be related to the completion of the western boundary fence and widened provision of surface water within the park. Conservation implications: The objectively recorded distribution patterns provide a foundation for assessing future changes in distribution that may take place in response to climatic shifts or other influences.
Populations of certain large ungulates have declined within the Kruger National Park (KNP) as well as elsewhere in Africa (Craigie et al. 2010; Ogutu & Owen-Smith 2003). The challenge is to establish the causal influences underlying these population changes and, in particular, to distinguish extrinsic drivers such as climatic shifts from intrinsic factors such as fencing, water distribution and fire pattern, which can be managed more directly. Changing distribution patterns provide potentially helpful clues to the nature of mechanisms negatively operating on a population within a conservation area such as the KNP (Gaston 1990, 2003; Lawton 1993). Climatic influences should be reflected by distributional shifts along gradients in temperature or rainfall and underlain by consequent changes in habitat suitability. More local causes would be indicated by disparate changes in different regions of the species distribution.The foundational requirement is for prevailing distribution ranges to be established as sufficiently rigorous for future changes to be identified with confidence. Pienaar (1963) mapped the distribution patterns of all of the larger mammal species within the KNP from rangers’ observations over the preceding five years, road strip counts (1956–1961) and aerial counts covering the central section in 1960 and 1962. Whilst historically useful, these maps are obviously subjective and vague in the time period that they represent. Between 1977 and 1995, annual ecological aerial surveys were conducted recording the locations of all animals seen, which comprehensively covered almost the entire KNP from 1980 to 1993. Count totals for the larger ungulate species, partitioned amongst eight census compartments, were summarised in annual reports (e.g. Viljoen 1993). However, distribution patterns revealed at a finer scale by the actual animal locations recorded have not been synthesised. Hence, our starting aim was to document the recent distribution patterns of the larger ungulate species for comparison with the earlier patterns depicted by Pienaar (1963) and as a basis for further monitoring. Subsequent to the time period covered by Pienaar (1963), various changes potentially influencing the distribution of the larger herbivore species have occurred. The southern and western borders of the KNP became completely fenced in 1961, blocking the movement of animals between the park and adjoining private nature reserves, followed by the completion of a fence along the eastern border with Mozambique in 1976 (Joubert 2007a, 2007b). Between 1965 and 1975, the provision of artificial water sources in the form of earth dams, weirs on seasonal streams and drinking troughs supplied from boreholes was greatly expanded (Grant et al. 2002). After 1977, very little of the park area remained more than 5 km from the nearest perennial water source (Redfern et al. 2003). Fire policy has also changed in various ways, potentially influencing vegetation features and hence habitat conditions for large herbivores (Van Wilgen et al. 2004). The elephant population grew from a little over 1000 animals in 1962 to a total of over 7000 by 1968, after which annual removals curtailed further increase until this culling was suspended in 1995 (Whyte et al. 1999). Persistently low rainfall conditions prevailed in the late 1960s and then from 1982 through 1995, including exceptionally severe droughts in 1982–1983 and 1991–1992 (Owen-Smith & Ogutu 2003). This rainfall variation was associated with substantial changes in the abundance of certain ungulate species, including marked declines in populations of some of the less common antelope species (Mills, Biggs & Whyte 1995; Ogutu & Owen-Smith 2003; Owen-Smith, Mason & Ogutu 2005; Owen-Smith & Mills 2006). With these changes in mind, our specific objectives were: • To establish shifts in distribution accompanying the population changes of larger ungulates over the period spanned by the annual aerial surveys, in particular comparing the period prior to 1986
with that thereafter, when declines of less common species took place in association with persistently low rainfall conditions.
• To compare recent distribution patterns of these ungulates with those around 1960, as mapped by Pienaar (1963).
• To relate distribution patterns to the habitat types preferred or avoided by these species.
• To assess how changes in surface water availability might have affected regional concentrations.
Study area
Gertenbach (1983) and Venter, Scholes and Eckhardt (2003) provided detailed descriptions of climate, vegetation and geology within the nearly 20 000 km2 area of the KNP. Briefly, mean annual rainfall declines from about 750 mm in the south-west to around 400 mm in parts of the north, falling mostly during the summer wet season between October and March. In the southern half, the vegetation is predominantly knob thorn (Acacia nigrescens) and marula (Sclerocarya birrea) savannah on basalt substrates in the east, and Combretum spp. savannah on granitic substrates in the west. Mopane (Colophospermum mopane) dominates the woody vegetation in the northern half on both substrates.
Data source
The ecological aerial surveys were conducted between May and August when visibility conditions are best (Viljoen 1993). Hence, our distributional analysis represents dry season conditions only. Four observers, besides the pilot and recorder, counted all animals seen using transects spaced 800 m apart covering successive blocks. From 1980 through 1986, animal locations were mapped within a 2 km × 2 km grid (Joubert 1983). After 1986, a palmtop computer coupled with a GPS unit recorded the coordinates of animals seen (Viljoen & Retief 1994). Hence, the positional inaccuracy could be up to 2 km prior to 1987 but within 0.8 km from 1987 onwards (Viljoen & Retief 1994). The area north of Punda Maria was not consistently covered and hence was excluded from our analysis. The hilly region in the extreme south-west was also less reliably covered. The species considered were, in order of abundance, impala (Aepyceros melampus), plains zebra (Equus quagga), African buffalo (Syncerus caffer), blue wildebeest (Connochaetes taurinus), greater kudu (Tragelaphus strepsiceros), giraffe (Giraffa camelopardalis), common waterbuck (Kobus ellipsiprymnus), warthog (Phacochoerus africanus), sable antelope (Hippotragus niger), tsessebe (Damaliscus lunatus), eland (Taurotragus oryx) and roan antelope (Hippotragus equinus).
Data analysis
Distribution range estimation
We used the adaptive local convex hull (a-LoCoH) method, developed for home range analysis (Getz & Wilmers 2004; Getz et al. 2007), to assess the distribution ranges. This method is more sensitive to gaps in occurrence, and less influenced by outliers, than parametric kernel methods. We generated point shape files of the geographical locations of animal herds in Arc Map 10.0, (Environmental Systems Research Institute 2010) and applied the a-LoCoH spatial analyst tool (Getz et al. 2007). Local minimum convex hulls were constructed from a variable number (k) of neighbouring points to a location or root point. Initially, we fixed the value of k at 3 and the value of the distance (a) from the root point at 1 km. We then plotted the area of the estimated distribution range versus increasing values of a to find the point where the area began to level off (i.e. the minimum spurious hole covering [MSHC]) value of a (Getz et al. 2007). With a fixed at this value, we varied k to find its MSHC value. Thereafter, we used these joint MSHC values of a and k to construct the final distribution ranges. The union of hulls moving up from the smallest were used to construct isopleths (Getz et al. 2007). The 0.99 isopleth was used to define range limits for the most common species, because the 0.95 isopleth excluded a substantial number of animals. For remaining species, ranges limits were mapped using the 0.95 isopleth. The 0.75 isopleth was used consistently to demarcate core regions where most of the population was concentrated. We excluded records of single animals generally representing solitary males, which were potentially found outside the distribution range of breeding herds. For each species, location records were aggregated for the 7-year periods 1980–1986 (including the 1982–1983 drought but before population declines by rarer species were initiated) and 1987–1993 (covering the time when population declines by less common species were under way). For impala, the total number of location records exceeded computing capacity and so were processed in separate batches representing the northern and southern halves of the KNP, later merged for display purposes.
Regional distribution range change
To investigate regional and temporal disparities in distribution patterns, we divided the KNP into four sections, separated by major rivers (Figure 1). The relative presence of herds consisting of two or more individuals in 5 km × 5 km cells in these sections was assessed separately for the pre-1987 and post-1986 periods. Cells that contained multiple records were treated as a single ’presence‘. We used log-linear models because both predictor and response variables were categorical, judging goodness-of-fit by the likelihood ratio statistic (L2) (Agresti 1996). To establish whether the distribution of a species had changed significantly between the two periods, we dropped the three-way or two-way interaction terms from models incorporating region and period as factors, checking whether the omission brought about a significant reduction in model fit. We examined z-scores for reduced models to establish which interactions contributed the most to the lack of fit when their effects were removed and to establish whether the effect was positive or negative (Christensen 1997; Knoke & Burke 1980).
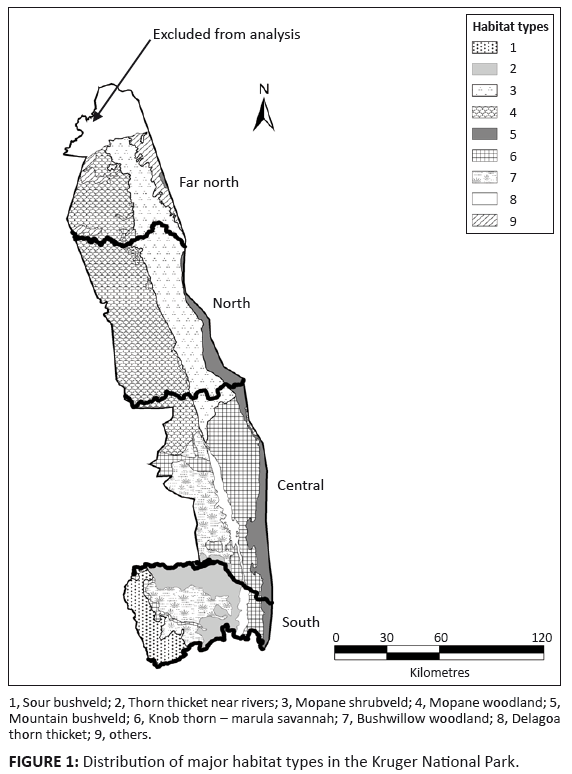 |
FIGURE 1: Distribution of major habitat types in the Kruger National Park.
|
|
Habitat associations
Gertenbach (1983) described 35 landscape types representing 15 major ecological units defined by vegetation structure and composition. We reduced his 15 ecological units to nine distinct habitat types (see Online Appendix) and grouped four minor habitats into the category ’other‘ (Figure 1). To assess relative habitat preferences, we compared the proportion of animals of each ungulate species mapped within each habitat type with the proportional availability of these habitats. Availability was estimated as the proportion of total area of the park covered. Habitat preference or avoidance was assessed separately for the pre-1987 and post-1986 periods. We interpreted a habitat type as being preferred if the proportional occupation exceeded twice the relative availability and avoided if this proportion was less than 0.5 of the relative availability. For species that exhibited distributional changes, we also assessed how this shift was reflected in habitat occupation. Changes in the proportion of occupied 5 km × 5 km cells per habitat type were compared between the pre-1987 versus the post-1986 periods, supported by Chi-square tests.
Comparison with earlier maps
Because the distribution patterns presented by Pienaar (1963) were somewhat subjective, they cannot be compared rigorously with those documented during the annual aerial surveys. Hence, we merely draw attention to the notable differences that seem apparent.
Impala
The overall distribution of impala expanded slightly between the pre-1987 and post-1986 periods (L2 = 9.171, df = 3, p = 0.027), without any significant change in regional proportions (Figure 2a). Impala occupied all habitats, showing a notable preference only for Delagoa thorn thicket (Table 1). However, occupation of sour bushveld by impala did increase significantly, by roughly 50%, after 1986 (χ2 = 12.136, df = 1, p = 0.001).
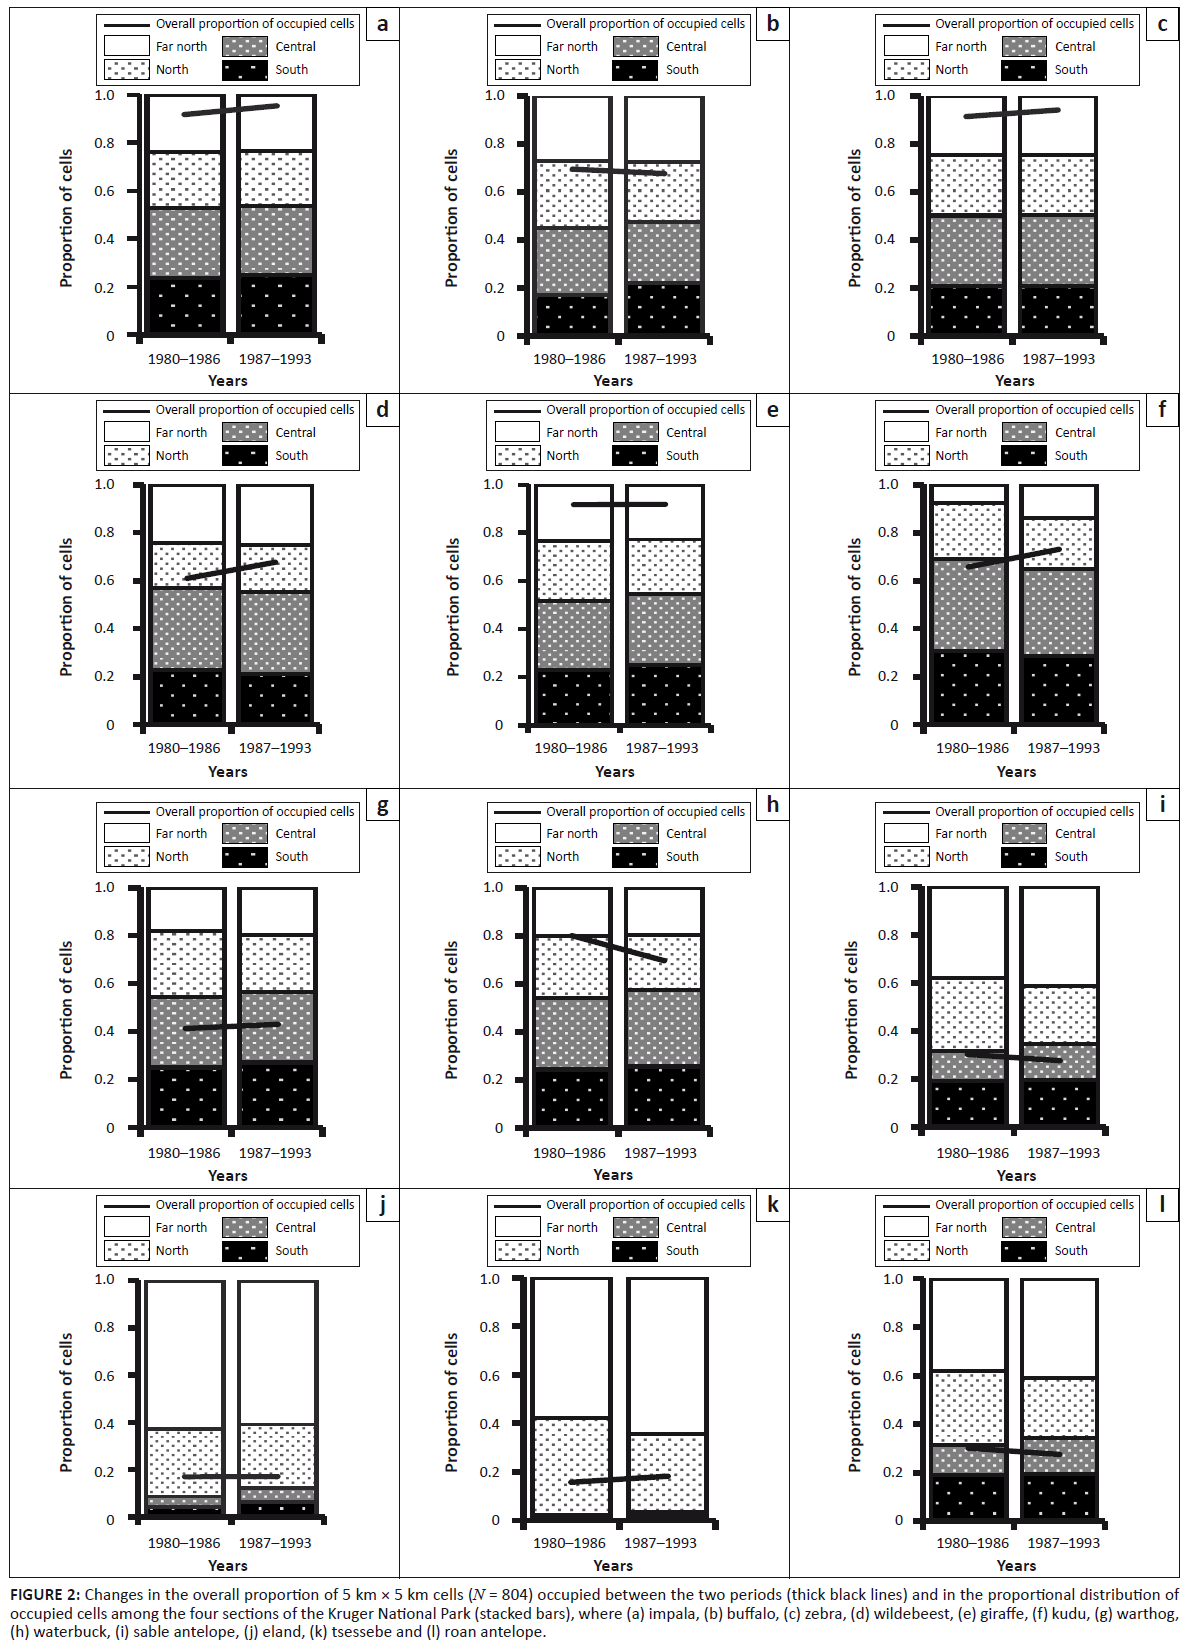 |
FIGURE 2: Changes in the overall proportion of 5 km ū 5 km cells (N = 804) occupied between the two periods (thick black lines) and in the proportional distribution of
occupied cells among the four sections of the Kruger National Park (stacked bars), where (a) impala, (b) buffalo, (c) zebra, (d) wildebeest, (e) giraffe, (f) kudu, (g) warthog,
(h) waterbuck, (i) sable antelope, (j) eland, (k) tsessebe and (l) roan antelope.
|
|
|
TABLE 1: Proportion of animal sightings recorded in 0.99 probability isopleths for common species within each habitat type, expressed as a percentage relative to the
proportional extent of these habitats in the Kruger National Park.
|
In addition, although impala showed no obvious change in distribution pattern between the two periods, they remained absent from some regions of the KNP. Gaps were evident in sections of the east and in the extreme south-west (Figure 3). Impala were more common in the southern half of the KNP than in the north, noting that distribution patterns must be assessed independently between the two halves of the KNP. Concentration areas were associated with perennial and seasonal rivers on the western granitic region of the northern part, but more widespread away from rivers in the wetter southern part. The distribution of impala mapped by Pienaar (1963) showed a tighter concentration along rivers, particularly in the northern half of the KNP, than was apparent after 1980.
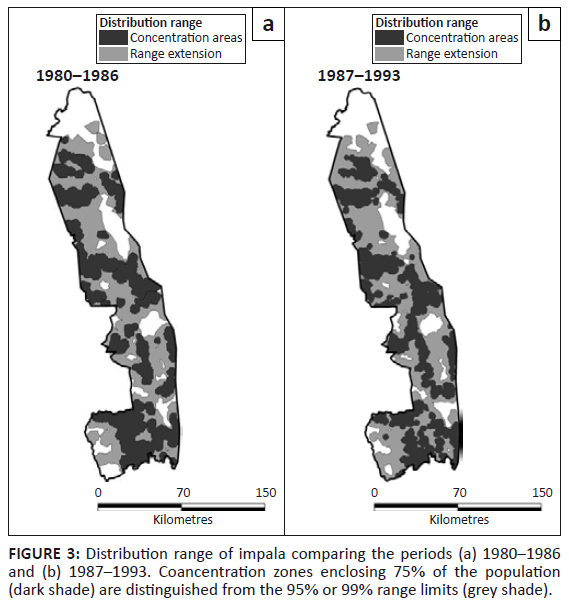 |
FIGURE 3: Distribution range of impala comparing the periods (a) 1980–1986
and (b) 1987–1993. Coancentration zones enclosing 75% of the population
(dark shade) are distinguished from the 95% or 99% range limits (grey shade).
|
|
Buffalo
Buffalo were likewise distributed through most of the KNP, with local concentrations near rivers during the dry season. However, their occurrence in the south-western region appeared somewhat more patchy prior to 1987 than subsequently (Figure 4). The buffalo distribution mapped by Pienaar (1963) showed a strong concentration along rivers in the dry season and an expansion over most of the park in the wet season. Relatively few buffalo were found in the south-west region prior to 1963.
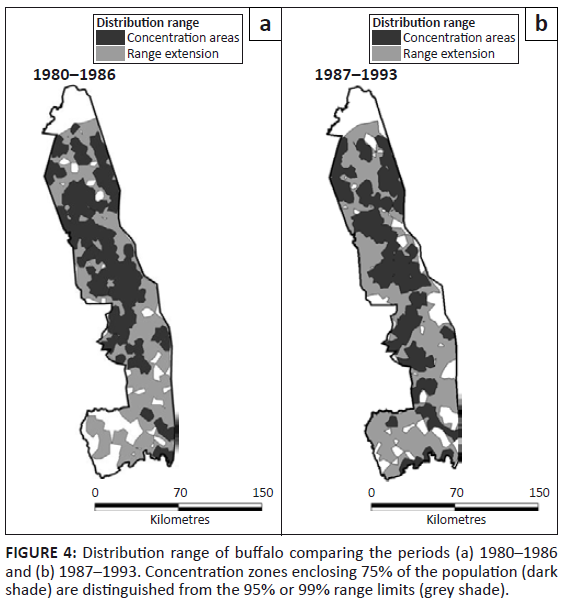 |
FIGURE 4: Distribution range of buffalo comparing the periods (a) 1980–1986
and (b) 1987–1993. Concentration zones enclosing 75% of the population (dark
shade) are distinguished from the 95% or 99% range limits (grey shade).
|
|
The change in buffalo distribution between the two periods differed between sections (L2 = 13.276, df = 3, p = 0.004). Buffalo became distributed more widely in the North (z = 2.879, p = 0.004) and South (z = 6.490, p = 0.001) at the expense of the Central and Far North sections (Figure 2b). Buffalo occupied all habitat types and showed a marked increase in their presence in sour bushveld after 1986 (χ2 = 9.733, df = 1, p = 0.002).
Zebra
Zebra occurred throughout the KNP, except for gaps south-west of the Sabie River and near the Crocodile River (Figure 5). Pienaar’s (1963) map shows a basically similar distribution, except for his demarcation of the south-eastern region of the Central section as wet season range.
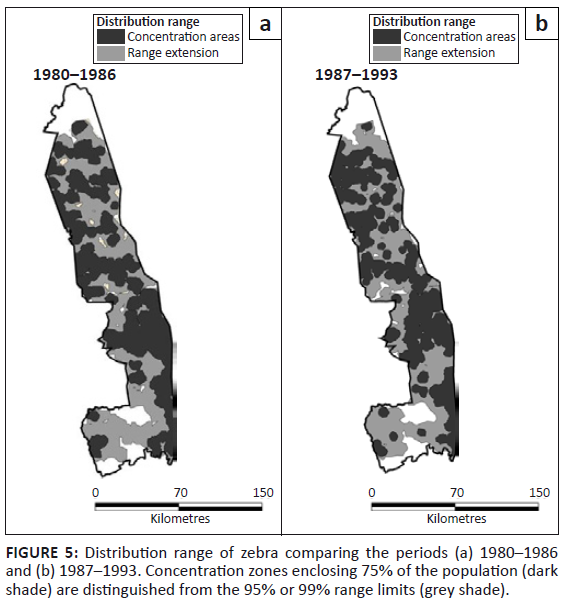 |
FIGURE 5: Distribution range of zebra comparing the periods (a) 1980–1986
and (b) 1987–1993. Concentration zones enclosing 75% of the population (dark
shade) are distinguished from the 95% or 99% range limits (grey shade).
|
|
Dropping two-way interactions from models incorporating period and region as factors brought about a significant reduction to model fit (L2 = 96.103, df = 10, p = 0.001), suggesting that zebra distribution changed between the two periods, with most range expansion occurring in the Far North (z = 2.429, p = 0.027) (Figure 2c). Zebra occupied all habitats, but tended to avoid thorn thickets near rivers and sour bushveld, although their presence in the latter habit increased slightly, but significantly, after 1986 (Table 1; χ2 = 5.595, df = 1, p = 0.032).
Wildebeest
Wildebeest were concentrated in the Central section and distributed more patchily in the South as well as north of the Olifants River (Figure 6). Pienaar’s (1963) map shows additional dry season concentrations along the western border of the Central and South sections. The eastern region of the Central section was shown formerly as wet season range. A pocket in the far north-west was no longer present after 1980.
 |
FIGURE 6: Distribution range of wildebeest comparing the periods (a)
1980–1986 and (b) 1987–1993. Concentration zones enclosing 75% of the population
(dark shade) are distinguished from the 95% or 99% range limits (grey shade).
|
|
Although the proportion of wildebeest in broader regions of the KNP appeared to have changed little, dropping two-way interactions incorporating period and region as factors brought about a significant reduction of model fit (L2 = 92.835, df = 10, p = 0.001), indicating the distribution changed between the regions after 1986, with most of the range expansion occurring in Far North (z = 5.352, p = 0.001) (Figure 2d). Wildebeest strongly favoured knob thorn – marula savannah on basalt and tended to avoid mopane woodland, thorn thickets near rivers, sour bushveld and sandveld (Table 1). Their presence in bushwillow woodland increased marginally after 1986 (χ2 = 5.760, df = 1, p = 0.016).
Kudu
Kudu were distributed throughout the KNP, but with a greater concentration in the southern half than in the northern sections (Figure 7). Pienaar’s (1963) map shows a blanket distribution of kudu throughout the KNP.
 |
FIGURE 7: Distribution range of kudu comparing the periods (a) 1980–1986 and
(b) 1987–1993. Concentration zones enclosing 75% of the population (dark
shade) are distinguished from the 95% or 99% range limits (grey shade).
|
|
Although the overall occurrence of kudu remained high after 1986, their relative presence in the northern half of KNP contracted (Figure 2e; L2 = 23.407, df = 3, p = 0.001). Kudu positively selected mountain bushveld and avoided sandveld (Table 1). Their presence in mopane shrubveld decreased significantly after 1986 (χ2 = 6.572, df = 1, p = 0.017), but it increased in sour bushveld (χ2 = 7.419, df = 1, p = 0.012).
Giraffe
Giraffe occurred throughout the southern half of KNP, but were more sparsely distributed in the northern half (Figure 8). Pienaar’s (1963) map shows that they had formerly been absent from the mopane zone north of the Letaba River, except for a pocket in the north-eastern basaltic plains.
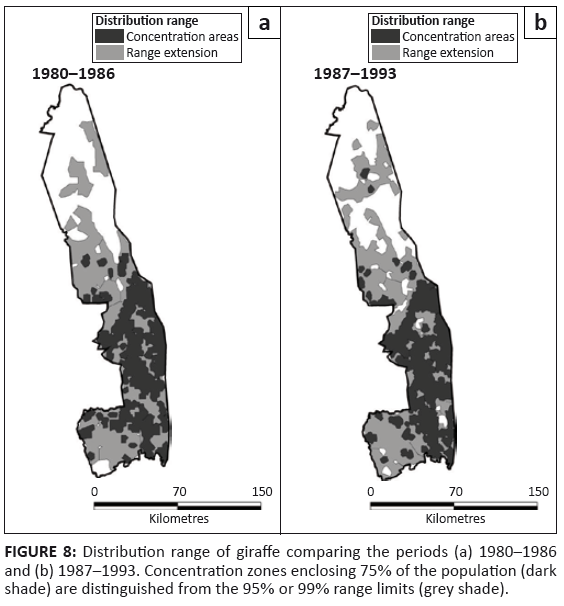 |
FIGURE 8: Distribution range of giraffe comparing the periods (a) 1980–1986
and (b) 1987–1993. Concentration zones enclosing 75% of the population (dark
shade) are distinguished from the 95% or 99% range limits (grey shade).
|
|
Giraffe continued expanding their presence in the northern half of the KNP during the survey period (L2 = 9.454, df = 3, p = 0.024), particularly in the Far North (z = 6.907, p = 0.001) (Figure 2f). Nevertheless, in general they avoided mopane-dominated vegetation as well as the sandveld, but occurred fairly evenly through other habitat types (Table 1).
Waterbuck
Waterbuck showed a ribbon distribution concentrated along perennial and seasonal rivers (Figure 9). Pienaar’s (1963) map shows a restricted distribution of waterbuck along rivers very similar to that documented during the subsequent surveys.
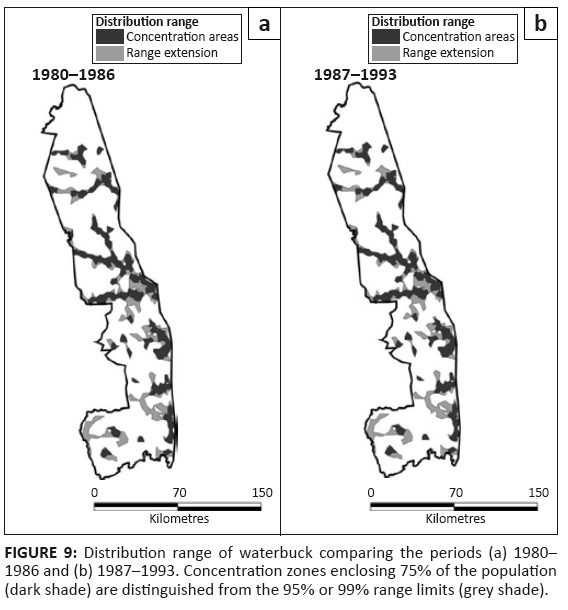 |
FIGURE 9: Distribution range of waterbuck comparing the periods (a) 1980–
1986 and (b) 1987–1993. Concentration zones enclosing 75% of the population
(dark shade) are distinguished from the 95% or 99% range limits (grey shade).
|
|
Although the overall proportion of occupied 5 km × 5 km cells in the KNP appeared to have increased much (L2 = 18.954, df = 10, p = 0.041), the actual regional distribution did not change significantly (Figure 2g; L2 = 2.595, df = 3, p = 0.476) after 1986. Waterbuck favoured mountain bushveld, whilst avoiding bushwillow woodland, thorn thickets and sandveld (Table 2).
|
TABLE 2: Proportion of animal sightings recorded in 0.95 probability isopleths for less common species within each habitat type, expressed as a percentage relative to the
proportional extent of these habitats in the Kruger National Park.
|
Warthog
Warthog occurred over most of the KNP prior to 1987, but after 1986 had disappeared from most of the basaltic region of the north-east (Figure 10). Warthog appeared to be restricted more narrowly to the vicinity of rivers in the northern half of the KNP around 1960 than was evident after 1980 (Pienaar 1963).
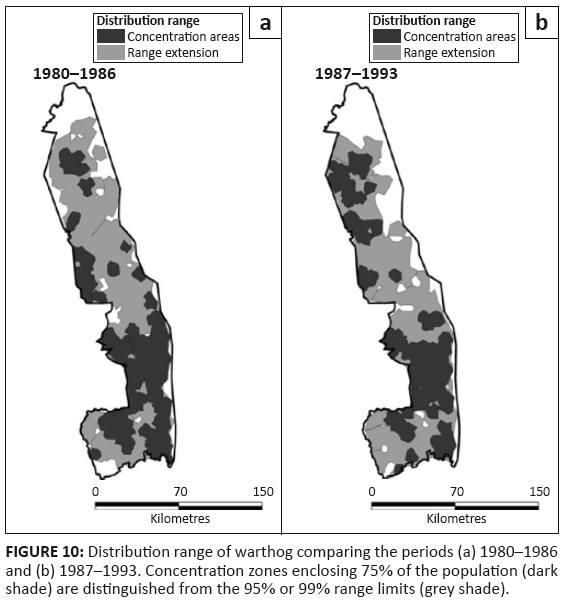 |
FIGURE 10: Distribution range of warthog comparing the periods (a) 1980–1986
and (b) 1987–1993. Concentration zones enclosing 75% of the population (dark
shade) are distinguished from the 95% or 99% range limits (grey shade).
|
|
Warthog showed a slight shrinkage in their distribution, which seemed to be concentrated more in the southern half of the KNP (Figure 2h; L2 = 5.257, df = 3, p = 0.154). Warthog did not appear to favour any habitat type, whilst avoiding sour bushveld and sandveld. After 1986, warthog became less commonly present in mopane-shrubveld (χ2 = 33.893, df = 1, p = 0.001) and mountain bushveld (χ2 = 6.812, df = 1, p = 0.014).
Sable antelope
Sable antelope showed a patchy distribution in the southern half of the KNP, but occurred more continuously in the northern part (Figure 11). They had disappeared from sections of the north-east after 1986, following their general population decline. Sable formerly had a wider distribution in the south-west and in the western region of the Central section of the KNP than was recorded after 1980 (Pienaar 1963).
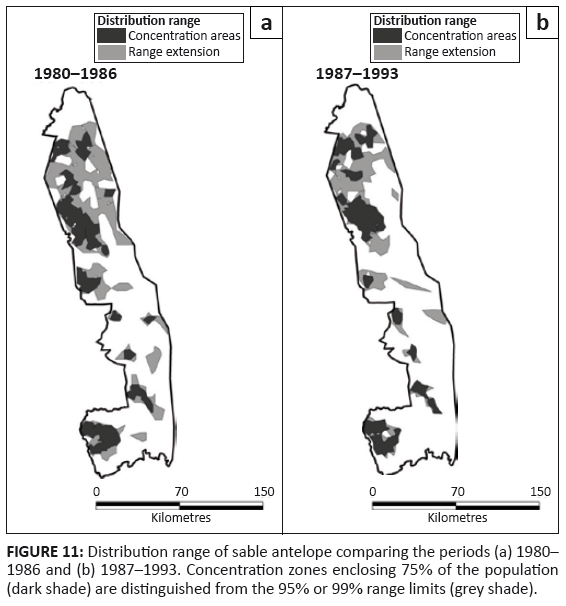 |
FIGURE 11: Distribution range of sable antelope comparing the periods (a) 1980–
1986 and (b) 1987–1993. Concentration zones enclosing 75% of the population
(dark shade) are distinguished from the 95% or 99% range limits (grey shade).
|
|
Overall, the proportion of cells occupied by sable contracted after 1986 (L2 = 131.640, df = 10, p = 0.001), despite no significant change in their regional distribution (L2 = 3.523, df = 3, p = 0.318) (Figure 2i). Although most sable occurred in mopane woodland, they showed a relative preference for sour bushveld and sandveld, whilst avoiding knob thorn – marula savannah, mountain bushveld and thorn thickets (Table 2). After 1986, they had declined most substantially in their presence in mopane-shrubveld (χ2 = 8.812, df = 1, p = 0.012).
Tsessebe
Tsessebe were found mostly in the north-east region of the KNP, apart from an isolated pocket in the south-east (Figure 12). Around 1960, tsessebe had occurred throughout the Far North as well as along the western border of the Central section (Pienaar 1963).
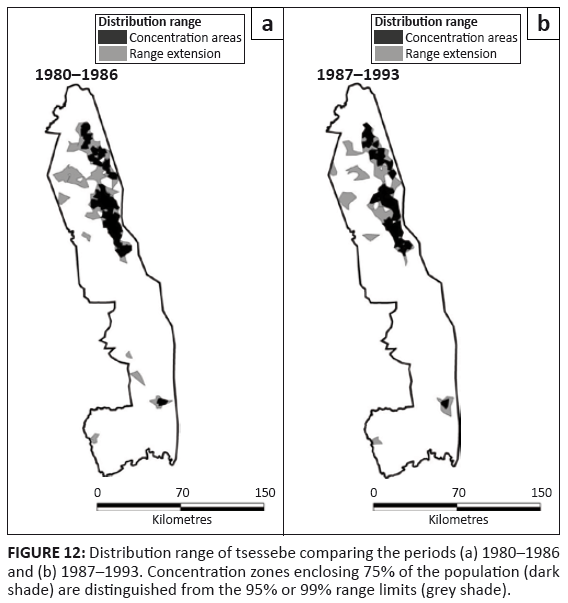 |
FIGURE 12: Distribution range of tsessebe comparing the periods (a) 1980–1986
and (b) 1987–1993. Concentration zones enclosing 75% of the population (dark
shade) are distinguished from the 95% or 99% range limits (grey shade).
|
|
The distribution range of tsessebe remained unchanged despite their population decline after 1986, both absolutely and relatively (Figure 2j; L2 = 1.026, df = 3, p = 0.795). Tsessebe showed a restriction almost entirely to mopane-shrubveld (Table 2).
Eland
Eland were present through much of the northern half of the KNP, with a concentration in the Far North (Figure 13). Their distribution appears to have been somewhat more extensive in the northern half around 1960 than recorded more recently (Pienaar 1963). Eland remained restricted almost entirely to mopane woodland and shrubveld (Table 2).
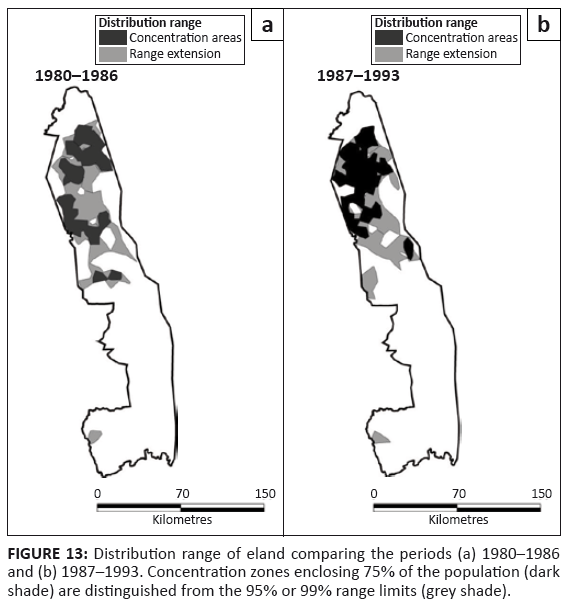 |
FIGURE 13: Distribution range of eland comparing the periods (a) 1980–1986
and (b) 1987–1993. Concentration zones enclosing 75% of the population (dark
shade) are distinguished from the 95% or 99% range limits (grey shade).
|
|
Roan antelope
Roan antelope were present patchily in the north-eastern region of the KNP and the isolated pockets that had occurred in the north-west and south-west had disappeared after 1986 (Figure 14). Prior to 1963, roan were widely distributed through most of the Far North and occurred also in a pocket in the north-west of the Central section (Pienaar 1963). Their presence in the south-west appears to have been somewhat wider than the isolated herd recorded there after 1980. Roan occupied mostly the mopane shrubveld (Table 2).
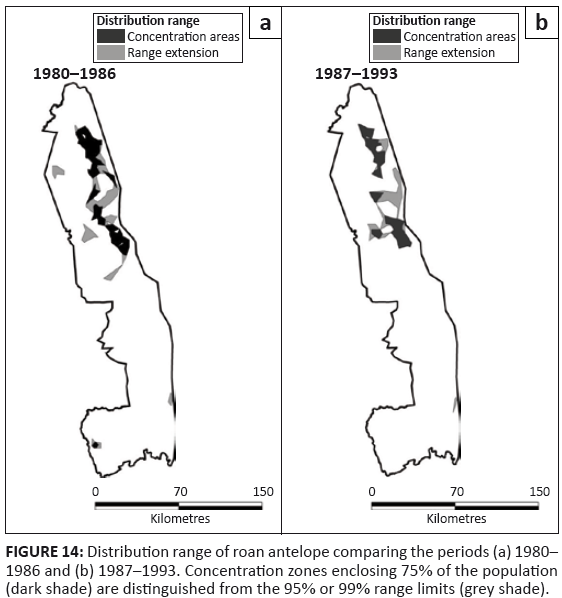 |
FIGURE 14: Distribution range of roan antelope comparing the periods (a) 1980–
1986 and (b) 1987–1993. Concentration zones enclosing 75% of the population
(dark shade) are distinguished from the 95% or 99% range limits (grey shade).
|
|
This study comprises our joint original research, apart from our dependence on the aerial survey data made available to us by national parks scientists. Aerial surveys are inevitably undercounts and the extent of the bias can be affected by prevailing conditions. However, from the experience of park scientists, which is also supported by differential ground counts, we do not think undercounting will bias the current interpretation. Furthermore, surveys were conducted in well-defined census blocks using similar techniques and methods over the 14-year study period, a factor which improves the reliability of the data and validity of the conclusions reached.
Kudu, zebra, buffalo and impala were the species distributed most widely throughout the KNP. Although wildebeest and warthog also occurred widely in the southern half, they showed a more restricted distribution in the northern half of the park, a pattern exhibited more extremely by giraffe. Waterbuck were concentrated mainly along rivers, but also in mountain bushveld along the eastern border. Less common antelope species, such as sable antelope, tsessebe, eland and roan antelope, showed patchy distributions concentrated mostly in the northern half of the park. Wildebeest, giraffe, zebra and warthog favoured the knob thorn – marula savannah on basalt substrates, whilst sable antelope, tsessebe, eland and roan antelope favoured mopane-dominated vegetation in the north and, in the case of sable antelope, also the sour bushveld and sandveld that was negatively selected by other herbivore species. Relative declines in the proportion of the population found in the more arid northern half of the KNP could be a consequence of progressive habitat degradation following the extreme drought conditions experienced in 1982–1983 and 1992–1993 and persistently low rainfall from 1987 through 1994. The greatly widened surface water distribution in this region of the KNP may have contributed by attracting increased presence of zebra, which interacted with the rarer grazers either by pre-empting resources or by attracting greater numbers of lions under these stressful conditions (Owen-Smith & Mills 2006). The increased presence of buffalo herds in the south-west could have contributed to the decline in sable numbers in this region (Owen-Smith et al. 2012). The maps presented by Pienaar (1963) suggest that the distributions of impala, buffalo and warthog were concentrated more strongly near rivers during the dry season prior to 1963 than was evident over 1980–1993, particularly in the northern half of the KNP. Their widened occupation of areas away from rivers was perhaps a consequence of the widened provision of artificial water sources during the 1970s. Around 1960, wildebeest, tsessebe and sable antelope had apparently been more prevalent in the west of the Central section of the park than more recently. Their decreased presence in this region is most likely a consequence of the western boundary fence completed in 1961, blocking dry season movements towards the private nature reserves to the west. Both wildebeest and zebra showed dry season concentrations over 1980–1993 in parts of the eastern Central section that were indicated as wet season range by Pienaar (1963). Zebra and giraffe widened their presence in the Far North compared with their occurrence there prior to 1963, whilst buffalo extended their distribution towards the south-west region of the South section. For zebra, the shift towards the north appeared to be a direct consequence of the widened availability of surface water there (Harrington et al. 1999). Sable antelope, roan antelope and tsessebe were formerly more widely distributed through the northern part of the KNP than was recorded after 1980. Whether this was caused by increasing aridity in this region or the increased presence of zebra, and hence a shared predator, cannot be established from the distribution change alone, although other evidence implicates increased predation as a contributory factor (Owen-Smith et al. 2012). Since 1995, many artificial waterpoints have been closed (Smit, Grant & Whyte 2007) and fences along parts of both the western and eastern boundaries have been removed. Vegetation changes are evident towards an opening of tree canopy cover in knob thorn – marula parkland, but with a greater density in shrub cover evident on granitic substrates (Eckhardt, Van Wilgen & Biggs 2000; Trollope et al. 1998). Rainfall within the park has recently shown wider annual variation than during the earlier historical record (Ogutu & Owen-Smith 2003). Elephants and white rhinos continue to increase towards abundance levels not manifested in the KNP region within the past 150 years, expanding their substantial impacts on vegetation structure. The consequences of increased atmospheric carbon dioxide levels for temperature regimes, rainfall and the competitive balance between C4 plants (primarily tropical grasses) and C3 plants (particularly woody trees and shrubs) are likely to become additional influences on vegetation trends and water flow in rivers. Hence, further changes in the populations and distributional ranges of large herbivores within the KNP are to be expected subsequent to the period covered by our data base. Our objectively derived maps provide a reference for future changes in distribution patterns to be identified.
Changes in the distribution patterns of several ungulate species have occurred since 1963 and seem to be continuing. We have identified the closure of the western boundary and expanded availability of perennial surface water sources as likely contributory influences recently, but further changes in distribution in response to the effects of climate change on vegetation are to be anticipated. Further monitoring of species presence that is both spatially comprehensive and sufficiently explicit locally will be needed to document the continuing effects of both extrinsic and intrinsic drivers on distribution ranges.
We express special thanks to Sandra MacFadyen for making available to us the spatial data for the KNP and for her quick responses to our queries. J.G. Chirima’s study was supported by a bursary awarded by the South African National Research Foundation.
Competing interests
The authors declare that they have no financial or personal relationship(s) which may have inappropriately influenced them in writing this paper.
Authors’ contributions
G.J.C. (University of the Witwatersrand) performed all the data analyses and wrote the manuscript. N.O-S. (University of the Witwatersrand) supervised G.J.C.’s (University of the Witwatersrand) PhD study and contributed to in-depth discussions through sharing his knowledge of animal and plant ecology pertaining to the KNP to improve the manuscript. B.F.N.E. (University of the Witwatersrand) co-supervised the PhD study and provided valuable comments to improve the manuscript. For publication, the manuscript was prepared when G.J.C. (University of the Witwatersrand) was working for the South African Environmental Observation Network and later the Agricultural Research Council.
Agresti, A., 1996, An introduction to categorical data analysis, John Wiley and Sons, New York.Christensen, R., 1997, Log-linear models and logistic regression, Springer-Verlag Inc., New York. Craigie, I.D., Baillie, J.E.M., Balmford, A., Carbone, C., Collen, B., Green, R.E. et al., 2010, ’Large mammal population declines in Africa’s protected areas’, Biological
Conservation 143, 2221–2228. http://dx.doi.org/10.1016/j.biocon.2010.06.007 Eckhardt, H.C., Van Wilgen, B.W. & Biggs, H.C., 2000, ‘Trends in woody vegetation cover in Kruger National Park, South Africa, between 1940 and 1998’, African Journal of Ecology 38,
108–115. http://dx.doi.org/10.1046/j.1365-2028.2000.00217.x Environmental Systems Research Institute, 2010, ArcMap version 10.0, computer software, ESRI, Redlands. Gaston, K.J., 1990, ‘Patterns in the geographic ranges of species’, Biological Reviews 65, 105–29.
http://dx.doi.org/10.1111/j.1469-185X.1990.tb01185.x Gaston, K.J., 2003, The structure and dynamics of geographic ranges, Oxford University Press, Oxford. Gertenbach, W.P.D., 1983, ‘Landscapes of the Kruger National Park’, Koedoe 26(1), 9–12. Getz, W.M. & Wilmers, C.C., 2004, ‘A local nearest-neighbor convex-hull construction of home ranges and utilization distributions’, Ecography 27, 498–505.
http://dx.doi.org/10.1111/j.0906-7590.2004.03835.x Getz, W.M., Fortmann-Roe, S., Cross, P.C., Lyons, A.J., Ryan, S.J. & Wilmers, C.C., 2007, ‘LoCoH: Nonparametric kernel methods for constructing home ranges and utilization distributions’,
PLoS ONE 2, 1–11. http://dx.doi.org/10.1371/journal.pone.0000207,
PMid:17299587
Grant, C.C., Davidson, T., Funston, P.J. & Pienaar, D.J., 2002, ‘Challenges faced in the conservation of rare antelope: A case study on the northern basalt plains of the Kruger
National Park’, Koedoe 45(2), 45–62. Harrington, R., Owen-Smith, N., Viljoen, P.C., Biggs, H.C., Mason, D.R. & Funston, P., 1999, ‘Establishing the causes of roan antelope decline in the Kruger National Park, South Africa’,
Biological Conservation 90, 69–78. http://dx.doi.org/10.1016/S0006-3207(98)00120-7 Joubert, S.C.J., 1983, ‘A monitoring programme for an extensive national park’, in R.N. Owen-Smith (ed.), Management of large mammals in African conservation areas, pp. 201–212, Haum, Pretoria. Joubert, S.C.J., 2007a, The Kruger National Park – A history, vol. 1, High Branching, Johannesburg. Joubert, S.C.J., 2007b, The Kruger National Park – A history, vol. 2, High Branching, Johannesburg. Knoke, D. & Burke, P.J., 1980, Log-linear models, Sage Publications Inc., Newberry Park. Lawton, J.H., 1993, ‘Range, population abundance and conservation’, Trends in Ecology and Evolution 8, 409–413.
http://dx.doi.org/10.1016/0169-5347(93)90043-O Mills, M.G.L., Biggs, H.C. & Whyte, I.J., 1995, ‘The relationship between rainfall, lion predation and population trends in African herbivores’, Wildlife Research 22, 75–88.
http://dx.doi.org/10.1071/WR9950075 Ogutu, J.O. & Owen-Smith, N., 2003, ‘ENSO, rainfall and temperature influences on extreme population declines among African savanna ungulates’, Ecology Letters 6, 412–419.
http://dx.doi.org/10.1046/j.1461-0248.2003.00447.x Owen-Smith, N. & Ogutu, J., 2003, ‘Rainfall influences on ungulate population dynamics’, in J.T. Du Toit, K.H. Rogers & H.C. Biggs (eds.), The Kruger experience: Ecology and management
of savanna heterogeneity, pp. 310–331, Island Press, Washington, DC. Owen-Smith, N., Mason, D.R. & Ogutu, J.O, 2005, ‘Correlates of survival rates for ten African ungulate populations: Density, rainfall and predation’, Journal of Animal Ecology 74, 774–788.
http://dx.doi.org/10.1111/j.1365-2656.2005.00974.x Owen-Smith, N. & Mills, G.L.M., 2006, ‘Manifold interactive influences on the population dynamics of a multispecies ungulate assemblage’, Ecological Monographs 76, 73–92.
http://dx.doi.org/10.1890/04-1101 Owen-Smith, N., Chirima, G.J., Macandza, V. & Le Roux, L., 2012, ‘Shrinking sable antelope numbers in Kruger National Park: What is suppressing population recovery?’,
Animal Conservation 15, 195–204.
http://dx.doi:10/1111/j.1469-1795.2011.00504.x Pienaar, U. de V., 1963, ‘The large mammals of the Kruger National Park – Their distribution and present-day status’, Koedoe 6, 1–37. Quinn, G.P. & Keough, M.J., 2002, Experimental design and data analysis for biologists, Cambridge University Press, Cambridge. Redfern, J.V., Grant, R., Biggs, H. & Getz, W., 2003, ‘Surface-water constraints on herbivores foraging in the Kruger National park, South Africa’, Ecology 84, 2092–2107.
http://dx.doi.org/10.1890/01-0625 Smit, I.P.J., Grant, C.C. & Whyte, I.J., 2007, ‘Landscape-scale sexual segregation in the dry season distribution and resource utilization of elephants in Kruger National Park, South Africa’,
Diversity and Distributions 13, 225–236. http://dx.doi.org/10.1111/j.1472-4642.2007.00318.x Trollope, W.S.W., Trollope, L.A., Biggs, H.C., Pienaar, D. & Potgieter, A.L.F., 1998, ‘Long-term changes in the woody vegetation of the Kruger National Park, with special reference to the effects of
elephants and fire’, Koedoe 41, 103–112. Van Wilgen, B.W., Govender, N., Biggs, H.C., Ntsala, D. & Funda, X.N., 2004, ‘Response of savanna fire regimes to changing fire management policies in a large African national park’, Conservation
Biology 18, 1533–1540. http://dx.doi.org/10.1111/j.1523-1739.2004.00362.x Venter, F.J., Scholes, R.J. & Eckhardt, H.C., 2003, ‘The abiotic template and its associated vegetation pattern’, in J.T. du Toit, K.H. Rogers & H.C. Biggs (eds.), The Kruger experience:
Ecology and management of savanna heterogeneity, pp. 82–129, Island Press, Washington, DC. Viljoen, P.C., 1993, ‘Ecological aerial surveys in the Kruger National Park: 1992’, Scientific Report 2/93, National Parks Board, Skukuza. Viljoen, P.C. & Retief, P.F., 1994, ‘The use of global positioning system for real-time data collected during ecological aerial surveys in the Kruger National Park, South Africa’, Koedoe 37(2),
149–157. Whyte, I.J., Biggs, H.C., Gaylard, A. & Braack, L.E.O., 1999, ‘A new policy for the management of the Kruger National Park’s elephant population’, Koedoe 42(1), 111–133.
|