|
Article Information
|
Authors:
Helga van der Merwe1
Margaretha W. van Rooyen1
Affiliations:
1Department of Plant Science, University of Pretoria,
South Africa
Correspondence to:
Helga van der Merwe
Email:
soekop@hantam.co.za
Postal address:
PO Box 1, Calvinia 8190,
South Africa
Dates:
Received: 10 Aug. 2010
Accepted: 25 May 2011
Published: 15 Sept. 2011
How to cite this article:
Van der Merwe, H. & Van Rooyen, M.W., 2011, ‘Guiding conservation efforts in the Hantam–Tanqua–Roggeveld (South Africa) using
diversity parameters’, Koedoe 53(1), Art. #1018, 9 pages.
doi:10.4102/koedoe.v53i1.1018
Copyright Notice:
© 2011. The Authors. Licensee: AOSIS OpenJournals. This work
is licensed under the Creative Commons Attribution License.
ISSN:
0075-6458 (print)
ISSN:
2071-0791 (online)
|
|
|
|
Guiding conservation efforts in the Hantam–Tanqua–Roggeveld (South Africa) using diversity parameters
|
|
In This Original Research...
|
Open Access
|
• Abstract
• Introduction
• Study area
• Methods
• Results
• Discussion
• Conclusion
• Acknowledgements
• Authors’ contributions
• References
|
|
The Hantam–Tanqua–Roggeveld subregion falls within the Succulent Karoo and Fynbos Biomes, which are both recognised as global biodiversity
hotspots that should be conserved. The objective of this study was to gather baseline biodiversity information that can be used to guide conservation
efforts. A total of 40 Whittaker plots were surveyed in the subregion and the various diversity parameters calculated from the data were compared across
the subregion and to available data for the Succulent Karoo and Fynbos Biomes. Species richness per 1000 m2ranged from nine to 100 species
across the subregion. Species richness for all plot sizes < 1000 m2 was significantly lower for the Tanqua Karoo than for both the
Winter Rainfall Karoo and Mountain Renosterveld. The latter two areas did not differ significantly from each other with regard to species richness. Species
richness was significantly higher only at the 1000 m2 scale in the Mountain Renosterveld compared to the Winter Rainfall Karoo. Evenness and
Shannon and Simpson indices did not differ significantly between the Mountain Renosterveld and Winter Rainfall Karoo; however, these values were significantly
higher than for the Tanqua Karoo.
A principal coordinate analysis of species richness data at seven plot sizes produced three distinct clusters. One cluster represented the Tanqua Karoo, with low
species richness, evenness, and Shannon and Simpson indices. Another cluster represented mostly Mountain Renosterveld vegetation, which was characterised by a high
species richness, evenness, and Shannon and Simpson indices. The third cluster was formed by the remaining Mountain Renosterveld plots as well as the Winter Rainfall
Karoo plots.
The high species richness values found in the various vegetation units can add valuable information to the conservation planning arena by providing information
on biodiversity parameters and their spatial distribution. This information can assist with conservation efforts in the Hantam, Tanqua and Roggeveld areas.
Conservation implications: Conservation and development of the Hantam–Tanqua–Roggeveld subregion is hampered by a lack of information on
floristic diversity. The results of the current study indicated areas of low diversity and contrasting areas of high diversity. These data can be used to
guide effective conservation and management of the floristic diversity.
The selection of protected areas worldwide has been largely influenced by economic, political and aesthetic factors rather than biodiversity representivity.
Thus, protected area systems under-represent many critical elements of biodiversity. Conservation planning concerns the location and design of reserves that
represent the biodiversity of a region, whilst at the same time enabling the persistence of that diversity by sustaining key ecological and evolutionary processes
(Cowling et al. 2003; Desmet et al. 2002). However, successful implementation will be possible only if the planning incorporates socio-economic
considerations (Berliner 2005) and identification of a general need to develop conservation landscapes that allow the maintenance of biodiversity whilst minimising
impacts on the livelihoods of local people (Driver, Cowling & Maze 2003).
A number of broad steps to systematic conservation planning have been identified (Margules & Pressey 2000), which include:
• compiling data on the biodiversity of the planning region
• identifying conservation goals in the planning region
• reviewing existing conservation areas
• selecting additional conservation areas
• implementing conservation actions
• maintaining the required values of the conservation areas.
There is an increased need for the optimisation of protected area systems within the political and socio-economic context, on the one hand, and the recognition
of the importance of the maintenance of ecological corridors and habitat connectivity, on the other.
Patterns of plant diversity and endemism have often been used for prioritising conservation activities (Lovett et al. 2000), with the premise that focusing
on areas rich in species is the most cost-effective way to retain maximal biological diversity and maintain key ecological functions (Giam et al. 2011;
Scott et al. 1987). Despite changing fashions and preoccupations, diversity has remained a central theme in ecology (Magurran 1988). Diversity has two
components, namely species richness (i.e. the number of plant species in a given area) and species evenness, which indicates how well biomass or abundance is
distributed amongst the species (Wilsey & Potvin 2000). Numerous indices exist that use species richness or evenness, as well as a combination of these two
components, to quantify the diversity within a region. In spite of various criticisms, these indices can aid in addressing problems associated with the conservation
of natural heritage or the changes in global ecology (Mouillot & Leprêtre 1999).
The Hantam–Tanqua–Roggeveld represented one of the planning domains into which the Succulent Karoo was subdivided during the Succulent Karoo Ecosystem
Plan (SKEP) initiative. In the course of the SKEP programme it soon became apparent that planning of conservation and development in the subregion was hampered by
a paucity of information on plant diversity (Cilliers et al. 2002; Critical Ecosystem Partnership Fund 2003).
This article analyses the patterns of plant diversity in the Hantam, Tanqua and Roggeveld areas. Plant diversity parameters used include species richness at different
scales, species evenness and the Shannon and Simpson indices of diversity. These results can assist in guiding conservation efforts in the
Hantam–Tanqua–Roggeveld subregion.
The Hantam, Tanqua and Roggeveld as defined in this study, lie in the predominantly winter rainfall region of the Northern and Western Cape provinces of South
Africa and cover an area of approximately three million hectares. Annual rainfall ranges from 50 mm to 300 mm, with a maximum of 467 mm recorded
for Sutherland. Although described as a winter rainfall area, some summer thunderstorms do contribute to the annual rainfall (Schulze 1997; Weather Bureau 1998).
Topographically, the Hantam, Tanqua and Roggeveld differ vastly. The Hantam landscape is gently undulating to steeply rolling, whereas the Tanqua Karoo covers
vast plains with scattered inselbergs. The escarpment, formed by the Roggeveld, Komsberg and Nuweveld Mountains, separates the Tanqua Karoo from the Roggeveld
plateau, which stretches eastwards from the escarpment into the interior of South Africa. Altitude ranges from approximately 290 m above sea level in the
Tanqua Karoo to about 1800 m above sea level along the Roggeveld escarpment.
Shallow lithosols and duplex soils characterise the Hantam Karoo, whilst scattered dolerite intrusions produce red structural and red vertic clays. Tanqua Karoo
soils comprise shallow lithosols that often include deep unconsolidated deposits in the alluvial parts or desert pavement. Soils of the Hantam Mountains and the
mountains of the great escarpment are shallow stony lithosols. The occasional lowlands contain duplex soils (Francis et al. 2007).
The study area stretches across two South African biomes, namely the Succulent Karoo and Fynbos. Both these biomes have been recognised as global biodiversity
hotspots. The Succulent Karoo occupies 111 000 km² and occurs in the western regions of Namibia and South Africa (Milton et al. 1997;
Mucina et al. 2006). At both local and regional scales, it is recognised as an area of high plant species diversity (Cowling et al. 1989). Compared
with similar arid environments, the species richness of the Succulent Karoo flora is exceptional (Cowling & Hilton-Taylor 1994). Several centres of endemism
have also been recognised within the Hantam–Tanqua–Roggeveld (Hilton-Taylor 1994; Van Wyk & Smith 2001). Although the Roggeveld mountain range was
included in the Succulent Karoo (SKEP) planning domain, there is some controversy as to whether it is actually part of the Fynbos Biome or the Succulent Karoo
Biome (Diels 1909; Hilton-Taylor 1994; Jürgens 1997; Low & Rebelo 1996; Marloth 1908; Mucina & Rutherford 2006; Van der Merwe & Van Rooyen 2011a;
Van Wyk & Smith 2001; Weimarck 1941), or even the Nama Karoo Biome (Acocks 1953, 1988; Rutherford & Westfall 1994). The Fynbos Biome, as delineated by
Rutherford and Westfall (1994), constitutes the major portion of the Cape Floristic Region (CFR). This region is recognised as one of the world’s plant
kingdoms (Good 1947) and, in addition, is recognised as a global hotspot of diversity (Cowling & Hilton-Taylor 1994). However, there is a close affiliation
between the Succulent Karoo and Fynbos Biomes and various authors have proposed the recognition of the Greater Cape Floristic Region (Born, Linder & Desmet
2007; Linder et al. 2010) or the Floristic Kingdom of the Greater Cape Flora (Jürgens 1997), which would include parts of both the Fynbos and the
Succulent Karoo Biomes.
The latest vegetation map of South Africa (Mucina, Rutherford & Powrie 2005; Mucina & Rutherford 2006), identified 12 vegetation types within the area.
A detailed phytosociological classification of the area recognised 25 subassociations, eight major plant associations and three major vegetation groups in the
study area (Van der Merwe, Van Rooyen & Van Rooyen 2008a, 2008b). The latter classification forms the basis of the current study.
In September 2005, a surveyor surveyed 40 sample plots according to Whittaker’s original plant diversity plot technique (Shmida 1984) across the eight
major vegetation associations described in the area (Van der Merwe et al. 2008a, 2008b). Various environmental data such as topography, geology, altitude,
aspect, slope, position on the slope, drainage, percentage stone and stone size, soil type and colour, erosion, trampling, and soil compaction were noted for each
plot.
Plots of seven different sizes (1 m², 5 m², 10 m², 20 m², 50 m², 100 m² and 1000 m²) were
used for comparisons of species richness. The total species number per 1 m2 and 5 m2 was determined as the mean of the species
number for the individual plots of the two respective size categories (n = 10 and n = 2, respectively). Species number per
10 m2 was calculated using the mean of the total number of species in ten plots of 1 m² plus two of 5 m². Species number per
20 m² was derived by counting all species in the 1 m² and the 5 m² plots. Additionally, the mean for the 50 m² (n = 2)
plots represented the number of species in this plot size, whilst all species encountered in these two plots represented the total species number per
100 m². The total number of species recorded at the site represented the species richness per 1000 m².
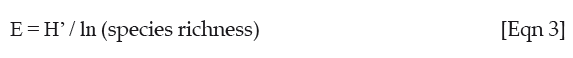
Shannon’s and Simpson’s indices of diversity (H’ and D, respectively) and a measure of evenness (E) were calculated for each sampled plot
at the 1000 m² (0.1 ha) size using PC-ORD (Version 4, MjM Software), which calculates the three diversity measures as follows:
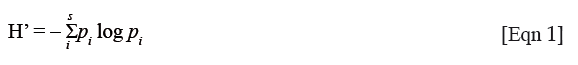
where pi = importance probability in column i.
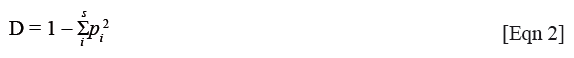
Simpson’s index of diversity (for an infinite population) is the complement of Simpson’s original dominance index and represents the likelihood
that two randomly chosen individuals will be different species.
Throughout the article values are compared to one another across the eight main vegetation associations described in Van der Merwe et al.
(2008a, 2008b). In addition, comparisons are made at a higher hierarchical level, for which some of the associations were grouped into larger vegetation groups:
• The three Mountain Renosterveld associations (associations 1–3 in Table 1) are collectively referred to as Mountain Renosterveld.
• The Escarpment Karoo, Hantam Karoo and Roggeveld Karoo associations (associations 4–6 in Table 1) are grouped together and called the Winter
Rainfall Karoo.
• The Tanqua and Loeriesfontein Karoo association, together with the Central Tanqua Grassy Plains association (associations 7 and 8 in Table 1) make up the
Tanqua Karoo.
The STATISTICA software package (versions 7 and 8, StaSoft Inc.) was used to perform statistical analyses. One-way analyses of variance (ANOVAs) with
Bonferroni’s post hoc test were performed to determine significant differences in diversity parameters between the vegetation associations
and between species richness for the different plot sizes. All ANOVAs were preceded by a test for normality. Principal coordinate analysis (PCoA) was
performed on species richness data for all seven plot sizes for the 40 surveyed plots using the SYN-TAX computer program (Podani 2001).
Species richness per sampled 1000 m² (0.1 ha) ranged from nine to 100 species (Table 1) and the mean per plant association from 12 to 89
species for this plot area (Figure 1). The mean number of species for the Mountain Renosterveld (79.0) was significantly higher than that of the Winter
Rainfall Karoo (64.6), which, in turn, was significantly higher than that of the Tanqua Karoo at 18.6 species (Tables 1 and 2).
|
TABLE 1: Plant diversity parameters as determined for the different vegetation groups in the Hantam–Tanqua–Roggeveld subregion (spring of 2005).
|
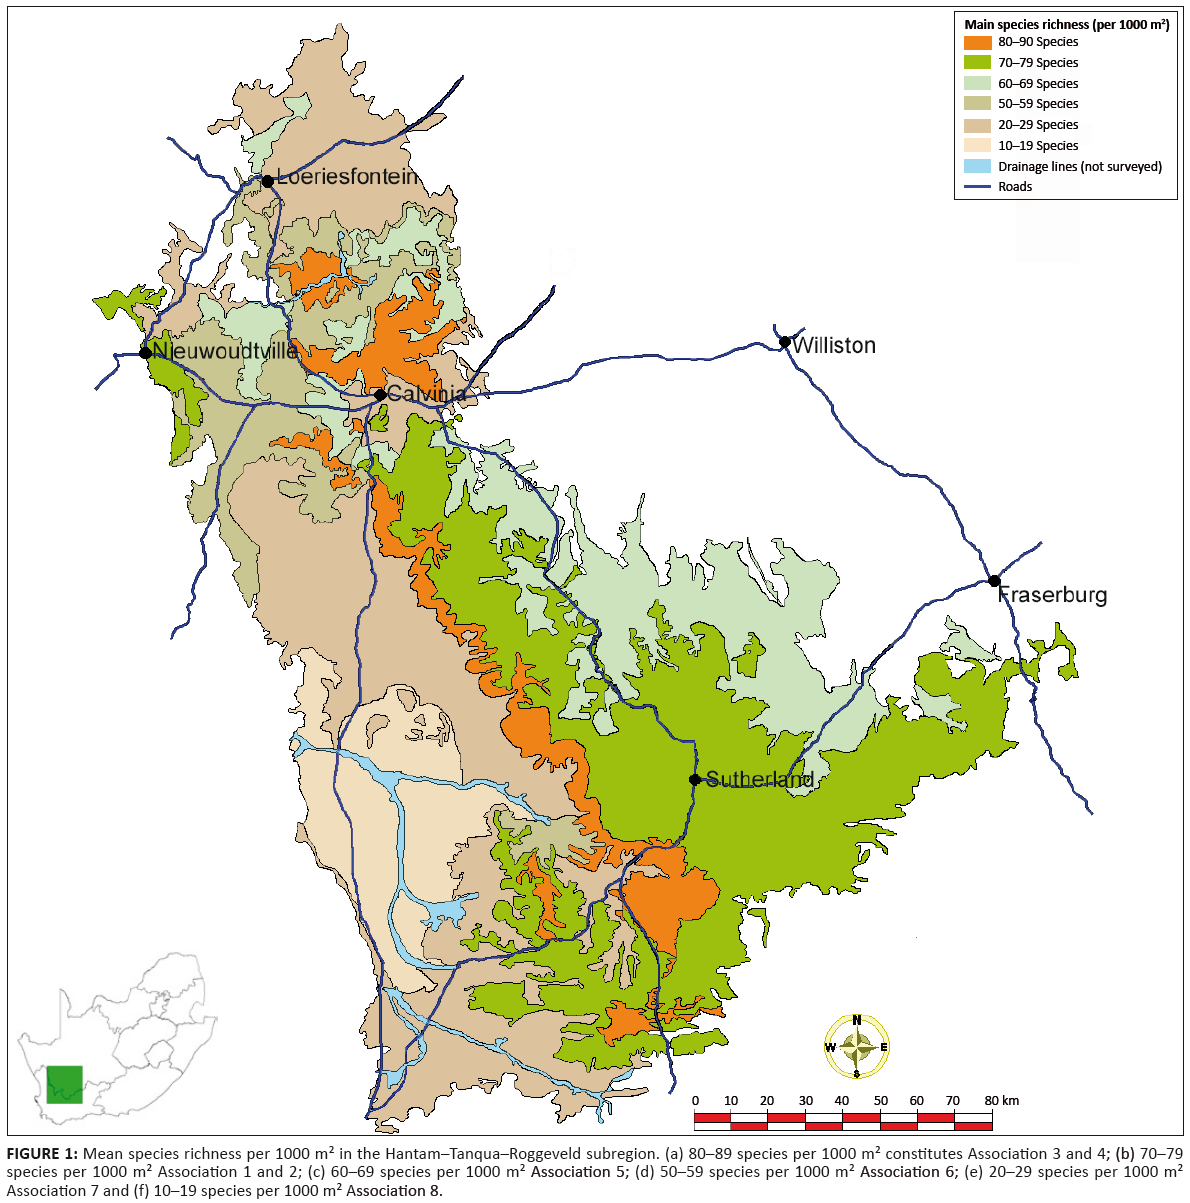 |
FIGURE 1: Mean species richness per 1000 m2 in the Hantam–Tanqua–Roggeveld subregion.
(a) 80–89 species per 1000 m2 constitutes Association 3 and 4; (b) 70–79
species per 1000 m2 Association 1 and 2; (c) 60–69 species per 1000 m2 Association 5; (d) 50–59 species per 1000 m˛ Association 6; (e) 20–29 species per 1000 m2
Association 7 and (f) 10–19 species per 1000 m2 Association 8.
|
|
|
TABLE 2: Mean values and significance for plant diversity parameters within the various identified vegetation groups.
|
A one-way ANOVA to compare species richness for the different plots sizes, indicated a significant difference between the Winter Rainfall Karoo and the
Mountain Renosterveld only at the 1000 m² plot size (Table 3). For all smaller plot sizes species richness was significantly lower in the Tanqua
Karoo than in both the Winter Rainfall Karoo and the Mountain Renosterveld (Table 3).
|
TABLE 3: Mean species richness values for a range of plot sizes within three vegetation groups in the Hantam–Tanqua–Roggeveld subregion.
|
A 13-fold range of evenness values was obtained for the 1000 m² (0.1 ha) plots across the entire study area. Evenness values determined across
the study area ranged from 0.065 in the Tanqua Karoo to 0.820 in the Mountain Renosterveld (Table 1). In all except two cases, evenness was found to be larger
than 0.4 (Table 1). Species evenness in the Mountain Renosterveld and Winter Rainfall Karoo was significantly higher than in the Tanqua Karoo (Table 2). The
evenness values for the Tanqua Karoo plots were generally less than 0.5, except for two plots (Table 1), whereas evenness values for the Winter Rainfall Karoo
and Mountain Renosterveld ranged from 0.501 to 0.820 (Table 1).
The diversity rankings of plots according to the Shannon (H’) and Simpson (D) indices were fairly similar. Both values are provided for comparisons to
other studies where only one of the indices has been calculated.
The values for the Shannon index across the study area ranged 26-fold, from 0.144 (Tanqua Karoo) to 3.743 (Mountain Renosterveld) (Table 1); except for two survey
plots in the Tanqua Karoo, all values were greater than 1.0. The mean Shannon index value for the Tanqua Karoo was significantly lower than for both the Winter
Rainfall Karoo and the Mountain Renosterveld (Table 2). No significant difference for the Shannon index was found between the latter two vegetation groups.
The range of Simpson index values found for this study varied from 0.043 (Tanqua Karoo) to 0.944 (Mountain Renosterveld) (Table 1). As for the Shannon index,
the mean Simpson index values for the Mountain Renosterveld and the Winter Rainfall Karoo were significantly higher than for the Tanqua Karoo. However, there
was no significant difference between the Simpson index values for the Mountain Renosterveld and the Winter Rainfall Karoo (Table 2).
The PCoA of data from the seven plot sizes showed three distinct clusters (Figure 2). The cluster on the left-hand side of the ordination represents a selection
of Mountain Renosterveld plots and included two plots that had been surveyed on the Gannaga Mountain Pass and belong to the Escarpment Karoo (association 4).
The cluster on the right-hand side of the ordination represents the Tanqua Karoo survey plots. Except for the two plots on the Gannaga Pass all other plots
surveyed in the Winter Rainfall Karoo belonged to the central cluster. However, several Mountain Renosterveld plots also fell within this cluster.
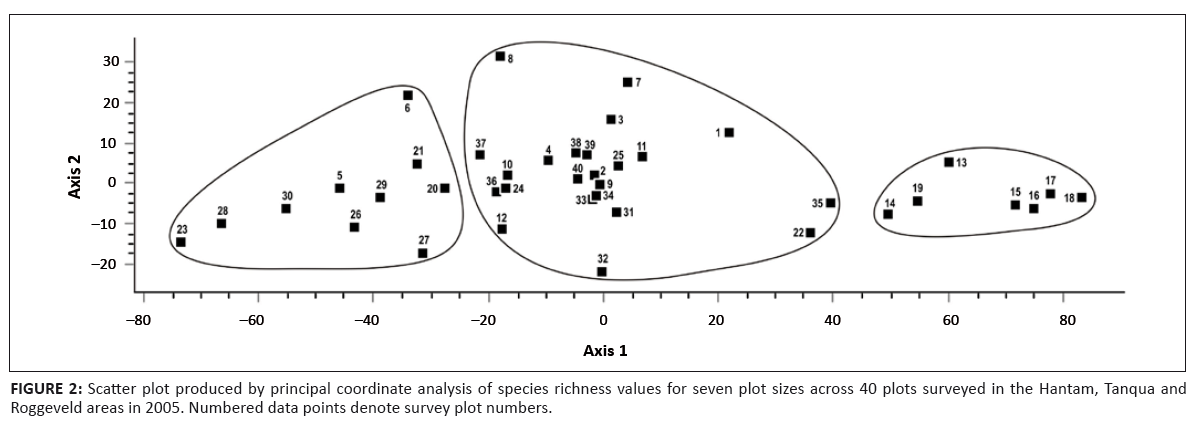 |
FIGURE 2: Scatter plot produced by principal coordinate analysis of species
richness values for seven plot sizes across 40 plots surveyed in the Hantam, Tanqua and
Roggeveld areas in 2005. Numbered data points denote survey plot numbers.
|
|
Cowling et al. (1989) reported that at a biome scale, the highest mean species richness value (per 1000 m2) was 86 for Renosterveld
(which is located within the Fynbos Biome) and 74 for Succulent Karoo. The biomes with the lowest species richness were Forest (51) and Nama Karoo (47).
Fynbos Biome richness ranges from 21 in southern Fynbos (Cowling et al. 1989) to 169 in Renosterveld (Schmiedel et al. 2010). Various studies
have reported mean species counts of 65–68 species per 1000 m² for fynbos vegetation (Cowling, Holmes & Rebelo 1992; Cowling & Holmes
1992; Procheş, Cowling & Mucina 2003; Richardson et al. 1995). Kongor (2009) and Tilman et al. (1983) reported similar mean species
richness values per 1000 m² (60 and 66, respectively) for Renosterveld, which is part of the Fynbos Biome. Some studies have, however, also reported
higher mean values, for example 84 by Cowling and Holmes (1992) and 123.7 by Schmiedel et al. (2010). The mean species richness of 79 (range: 62–99)
determined for the Mountain Renosterveld vegetation group in this study therefore compares well with previously reported values for Renosterveld. When comparing
sclerophyllous scrublands at a global scale, species richness of the Mountain Renosterveld vegetation is comparable to that of the South West Botanical Province
in Western Australia, with a mean richness of approximately 69 species. However, with a mean of 30 species (Cowling et al. 1992), the chaparral of
the California Floristic Province is poorer in species.
The Tanqua Karoo is located in the Succulent Karoo Biome; thus, the mean species richness value of 18.6 per 1000 m² (range 9–30) found in this
study is very low compared to the mean values of between 42.5 and 49.8 (Anderson & Hoffman 2007), 56.3 (Schmiedel et al. 2010), 74 (Cowling et
al. 1989) and 113 (Cowling et al. 1989) reported previously. The Winter Rainfall Karoo vegetation group, which also forms part of the Succulent
Karoo, had a mean species richness value of 64.6 per 1000 m² (range 31–100). These values lie between the means cited by Cowling et al.
(1989) and Anderson and Hoffman (2007). Since the annual and geophytic species constitute a large component of the Succulent Karoo and Fynbos Biome diversity,
the very poor rainfall of 2005 (the year in which the data were collected) could have led to an underestimation of true species richness (see Aronson &
Shmida 1992).
A comparison of species richness at different plot sizes revealed that the Tanqua Karoo plots consistently had the lowest values. However, the ranking of several
of the Winter Rainfall Karoo and Mountain Renosterveld plots varied quite considerably with increasing plot size. For example, plot W7 had a mean of 4.6 species
within 1 m2 and 79.0 species within 1000 m2, whereas plot W32 had three times as many species (14.4 species) within 1 m2
but only 47.0 species within 1000 m2. The observation that a significant difference in species richness between the Winter Rainfall Karoo and
Mountain Renosterveld was encountered only at the 1000 m² (0.1 ha) plot size, indicates the importance of surveying relatively large plots to notice
differences in species richness. This implies that most phytosociological data collected in South Africa at plot sizes of 200 m² or smaller could be
insufficient to indicate differences in species richness between vegetation groups. Although a study of data from local inventories (at the 1000 m2
scale) can be used for comparisons of variation in species richness across geographical space (Clinebell et al. 1995) it remains a local (alpha) scale study,
likely to retain signal factors such as soil nutrient status, which vary measurably on local scales (Whittaker, Willis & Field 2001).
Evenness is a measure of the ratio of observed diversity to maximum diversity and is constrained between 0.0 and 1.0, with 1.0 representing a situation in which
all species are equally abundant (Magurran 1988). The values found in this study were generally greater than 0.4, with Tanqua Karoo plot values seldom exceeding 0.5.
The Shannon index assumes, amongst others, that all species in the community are accounted for in the sample (Magurran 1988). However, it is likely that several
species in the community could have been missed in the sampling effort and thus the number of species found in the sample must be regarded as the lower bound of
the number of species in the population (Heltshe & Forrester 1983). In general, the Shannon diversity index ranges between 1.5 and 3.5 and only rarely
surpasses 4.5 (Magurran 1988). Shannon index values ranged from 1.143 (Tanqua Karoo) to 3.647 (Mountain Renosterveld) in this study.
The original Simpson index has been referred to as a dominance measure because it is weighted towards the abundances of the commonest species rather than providing
a measure of species diversity (Magurran 1988). In this study the complement of the original dominance measure (1–D) was used to provide an estimate of
diversity and Simpson index values ranged from 0.145 (Tanqua Karoo) to 0.943 (Mountain Renosterveld) in the current study. The values derived in this study are
believed to be underestimates of the potential values because of poor rainfall conditions during the data collection period.
An ordination of data for the seven plot sizes (Figure 2) confirmed that the Tanqua Karoo vegetation was very different from the vegetation in the rest of the study
area, and provides for interesting observations with respect to the Mountain Renosterveld of the subregion. The right-hand cluster represented the Tanqua Karoo plots,
with low species richness, evenness, and Shannon and Simpson indices. Slopes of species–area curves for these plots were shallow and the values for the
y-intercept low (Van der Merwe 2009; Van der Merwe & Van Rooyen 2011b). The left-hand cluster consisted of the ‘true’ Mountain Renosterveld
plots, with high vegetation cover and high species richness, evenness, and Shannon and Simpson indices. The analysis of the species–area curves for these
plots revealed a combination of steep slopes and high y-intercept values for most plots (Van der Merwe 2009; Van der Merwe & Van Rooyen 2011b). This
‘true’ Mountain Renosterveld occurs on sandstones of the Waterford Formation (Johnson et al. 2006) and is assumed to be more closely related
to the Renosterveld of the Fynbos Biome. However, the central cluster, which comprised the Winter Rainfall Karoo plots, also included Mountain Renosterveld plots,
indicating a strong link with the Succulent Karoo Biome.
Protected areas are the foundation of many conservation strategies and can be effective tools in maintaining biodiversity (Visconti et al. 2010). However,
many protected areas are unrepresentative of biodiversity patterns or the processes that generate and maintain these patterns (Rouget 2003). Conservation plans also
should not be static but should be updated regularly as new data and insights emerge, targets are adjusted and conservation priorities change (Cowling et al.
2003; Pressey, Cowling & Rouget 2003).
Information on species richness values and other diversity indices, as well as the ordination results that indicated the relationships between Mountain Renosterveld,
Tanqua Karoo and Winter Rainfall Karoo plots, can be used to guide conservation efforts in the Hantam–Tanqua–Roggeveld subregion. For example, associations
7 and 8 have some of the lowest levels of diversity, yet, they dominate the area conserved within the Tankwa Karoo National Park. However, a small area of associations
2 and 4, which both have a high level of diversity, does fall within the park. These areas could be notably expanded and the goal of the Tankwa Karoo National Park
could be to include areas within associations 1 and 6. This would actively conserve six of the eight associations in the Hantam–Tanqua–Roggeveld subregion,
including some of the most diverse associations in the region.
The results of this study should not only be included in the Tankwa Karoo National Park’s expansion plans but also be incorporated into the plans of the
provincial conservation agencies and those at regional and national planning levels.
The Fynbos and Succulent Karoo Biomes are recognised as global diversity hotspots. This article analysed the patterns of plant diversity in a botanically
unexplored part of these biomes, namely the Hantam–Tanqua–Roggeveld subregion. The species richness data collected for the Mountain Renosterveld
and Winter Rainfall Karoo in this study support earlier observations of high species richness values in the Succulent Karoo and Fynbos Biomes and confirms the
conservation importance of the Hantam–Tanqua–Roggeveld subregion.
Based on species richness data at seven plot sizes, a PCoA produced three distinct clusters. The one cluster represented the low species richness, evenness,
and Shannon and Simpson indices of the Tanqua Karoo plots, whilst on the other extreme a second cluster was formed by the ‘true’ Mountain Renosterveld
plots, with a high vegetation cover and high species richness, evenness, and Shannon and Simpson indices. The central cluster of the ordination diagrams consisted
of Winter Rainfall Karoo plots but also included some Mountain Renosterveld plots, indicating a strong link to the Succulent Karoo Biome.
In countries such as South Africa, where both funding and implementation capacity are limited, conservation actions frequently need to be scheduled (Visconti
et al. 2010). It is therefore important that conservation planning be data driven and target directed (Margules & Pressey 2000).
Selecting areas of high species richness is often used to guide conservation efforts. This practice is based on the fact that the meaning of species richness is
generally understood (Gaston 1996); many data on species richness are available and many correlations between species richness and other environmental diversity
parameters have been demonstrated (Gaston 1996; Lovett et al. 2000; Myers et al. 2000; Scott et al. 1987). Furthermore, selecting areas of
high species diversity is believed to be the most cost-effective way of allocating limited resources (Giam et al. 2011). However, Fleishman, Noss and Noon
(2006) caution against the use of species richness in isolation to prioritise locations for conservation. Additional metrics need to be included into a multi-criteria
approach, including, for example, endemism, functional significance of species and degree of habitat loss and human population pressure (Fleishman et al.
2006; Giam et al. 2011). Conservation areas should also not merely contain a high level of biodiversity initially, but ensure the persistence of species
and the key processes.
The data collected in this study can be included when planning conservation efforts for the expansion of current conservation areas (e.g. the Tankwa Karoo National
Park) and planning for future conservation areas, both at a local level and at regional or national levels.
We thank the Critical Ecosystem Partnership Fund (CEPF) through the Succulent Karoo Ecosystem Plan/Programme (SKEP) initiative for funding the project.
The CEPF is a joint initiative of Conservation International, the Global Environmental Facility, the Government of Japan, the MacArthur Foundation and the
World Bank. A fundamental goal is to ensure that civil society is engaged in biodiversity conservation. The various people who assisted with the field work
are gratefully acknowledged. CapeNature, the Department of Tourism, Environment and Conservation (Northern Cape) and SANParks are thanked for the necessary
permits and permission to conduct this research. This research was supported by the National Research Foundation under grant 61277.
Authors’ contributions
H.v.d.M. was responsible for the field surveys, data analysis and article preparation and was assisted by M.W.v.R.
Acocks, J.P.H., 1953, Veld types of South Africa, Botanical Survey of South Africa, Pretoria (Memoirs of the Botanical Survey of South Africa;
no 28).
Acocks, J.P.H., 1988, Veld types of South Africa, Dept. of Agriculture and Water Supply, Pretoria (Memoirs of the Botanical Survey of South Africa;
no 57).
Anderson, P.M.L. & Hoffman, M.T., 2007, ‘The impacts of sustained heavy grazing on plant diversity and composition in lowland and upland habitats across
the Kamiesberg mountain range in the Succulent Karoo, South Africa’, Journal of Arid Environments 70, 686−700.
doi:10.1016/j.jaridenv.2006.05.017
Aronson, J. & Shmida, A., 1992, ‘Plant species diversity along a Mediterranean-desert gradient and its correlation with interannual rainfall
fluctuations’, Journal of Arid Environments 23, 235−247.
Berliner, D., 2005, Systematic conservation planning for the forest biome of South Africa. Approach, methods and results of the selection of priority
forests for conservation action, Water and Forestry Support Programme, Department of Water Affairs and Forestry, Pretoria.
Born, J., Linder, H.P. & Desmet, P., 2007, ‘The Greater Cape Floristic Region’, Journal of Biogeography 34, 147−162.
doi:10.1111/j.1365-2699.2006.01595.x
Cilliers, C., Theron, H., Rösch, H. & Le Roux, A., 2002, ‘Succulent Karoo Ecosystem Plan, Sub-regional report, Hantam/Tanqua/Roggeveld’,
Succulent Karoo Ecosystem Plan report, Cape Town.
Clinebell, H.R.R., Phillips, O.L., Gentry, A.H., Stark, N. & Zuuring, H., 1995, ‘Prediction of neotropic tree and liana richness from soil and
climatic data’, Biodiversity Conservation 4, 56−90.
doi:10.1007/BF00115314
Cowling, R.M., Gibbs Russel, G.E., Hoffman, M.T. & Hilton-Taylor, C., 1989, ‘Patterns of plant species diversity in southern Africa’,
in B.J. Huntley (ed.), Biotic diversity in southern Africa: Concepts and conservation, pp. 19−50, Oxford University Press, Cape Town.
Cowling, R.M. & Hilton-Taylor, C., 1994, ‘Patterns of plant diversity and endemism in southern Africa: an overview’, in B.J. Huntley (ed.),
Botanical diversity in southern Africa, pp. 31−52, National Botanical Institute, Pretoria.
Cowling, R.M. & Holmes, P.M., 1992, ‘Endemism and speciation in a lowland flora from the Cape Floristic Region’, Biological Journal of the
Linnean Society 47, 367−383. doi:10.1111/j.1095-8312.1992.tb00675.x
Cowling, R.M., Pressey, R.L., Rouget, M. & Lombard, A.T., 2003, ‘A conservation plan for a global biodiversity hotspot – the Cape Floristic
Region, South Africa’, Biological Conservation 112, 191−216.
doi:10.1016/S0006-3207(02)00425-1
Cowling, R.M., Holmes, P.M. & Rebelo, A.G., 1992, ‘Plant diversity and endemism’, in R.M. Cowling (ed.), The ecology of fynbos: Nutrients,
fire and diversity, pp. 62−112, Oxford University Press, Cape Town.
Critical Ecosystem Partnership Fund, 2003, ‘Ecosystem Profile: The Succulent Karoo hotspot, Namibia and South Africa’, Critical Ecosystem
Partnership Fund report, Cape Town.
Desmet, P.G., Cowling, R.M., Ellis, A.G. & Pressey, R.L., 2002, ‘Integrating biosystematics data into conservation planning: Perspectives from
Southern Africa’s Succulent Karoo’, Systematic Biology 51, 317–330.
doi:10.1080/10635150252899798,
PMid:12028735
Driver, A., Cowling, R.M. & Maze, K.E., 2003, Planning for living landscapes: Perspectives and lessons from South Africa, Botanical Society of
South Africa, Cape Town.
Diels, L., 1909, ‘Formationen und Florenelemente im nordwestlichen Kapland’ [Formations and flora elements in the northwestern Cape], Botanische
Jahrbücher 44, 91−124.
Fleishman, E., Noss, R.F. & Noon, B.R., 2006, ‘Utility and limitations of species richness metrics for conservation planning’, Ecological
Indicators 6, 543–553. doi:10.1016/j.ecolind.2005.07.005
Francis, M.L., Fey, M.V., Prinsloo, H.P., Ellis, F., Mills, A.J. & Medinski, T.V., 2007, ‘Soils of Namaqualand: Compensations for aridity’,
Journal of Arid Environments 70, 588−603. doi:10.1016/j.jaridenv.2006.12.028
Gaston, K.J., 1996, ‘Species richness: measure and measurement’, in K.J. Gaston (ed.), Biodiversity: a biology of numbers and difference, pp.
77–113, Blackwell Scientific, Cambridge.
Giam, X., Sodhi, N.S., Brook, B.W., Tan, H.T.W. & Bradshaw, C.J.A., 2011, ‘Relative need for conservation assessments of vascular plant species
among ecoregions’, Journal of Biogeography 38, 55–68.
doi:10.1111/j.1365-2699.2010.02383.x
Good, R., 1947, The geography of flowering plants, Longmans, Green & Co., New York.
Heltshe, J.F. & Forrester, N.E., 1983, ‘Estimating species richness using the Jackknife Procedure’, Biometrics 39, 1−11.
doi:10.2307/2530802,
PMid:6871338
Hilton-Taylor, C., 1994, ‘Western Cape Domain (Succulent Karoo)’, in S.D. Davis, V.H. Heywood & A.C. Hamilton (eds.), Centres of plant
diversity. A guide and strategy for their conservation, pp. 201−203, IUCN Publications Unit, Cambridge.
Johnson, M.R., Van Vuuren, C.J., Visser, J.N.J., Cole, D.I., Wickens, H. DeV., Christie, A.D.M., Roberts, D.L. & Brandl, G., 2006, ‘Sedimentary
rocks of the Karoo Supergroup’, in M.R. Johnson, C.R. Anhaeusser & R.J. Thomas (eds.), The geology of South Africa, pp. 461−500,
The Geological Society of South Africa, Johannesburg/Council for Geoscience, Pretoria.
Jürgens, N., 1997, ‘Floristic biodiversity and history of African arid regions’, Biodiversity Conservation 6, 495−514.
doi:10.1023/A:1018325026863
Kongor, R.Y., 2009, ‘Plant response to habitat fragmentation: clues from species and functional diversity in three Cape lowland vegetation types of
South Africa’, PhD thesis, Dept. of Conservation Ecology and Entomology, University of Stellenbosch.
Linder, H.P., Johnson, S.D., Kuhlmann, M., Matthee, C.A., Nyffeler, R. & Swartz, E.R., 2010, ‘Biotic diversity in the Southern African winter-rainfall
region’, Current Opinion in Environmental Sustainability 2, 109–116.
Lovett, J.C., Rudd, S., Taplin, J. & Frimodt-Møller, C., 2000, ‘Patterns of plant diversity in Africa south of the Sahara and their implications
for conservation management’, Biodiversity and Conservation 9, 37–46.
doi:10.1023/A:1008956529695
Low, A.B. & Rebelo, A.G., 1996, Vegetation of South Africa, Lesotho and Swaziland, Dept. of Environmental Affairs and Tourism, Pretoria.
Magurran, A.E., 1988, Ecological diversity and its measurement, Cambridge University Press, Cambridge.
Margules, C.R. & Pressey, R.L., 2000, ‘Systematic conservation planning’, Nature 405, 43–253.
doi:10.1038/35012251,
PMid:10821285
Marloth, R., 1908, ‘Das Kapland, insonderheit das Reich der Kapflora, das Waldgebiet und die Karoo, pflanzengeografisch dargestellt’,
Wissenschaftliche Ergebnisse der Deutscher Tiefsee-Expedition ‘Waldivia’, 1898–1899 2, T. 3 [The Cape, with special
reference to the phytogeography of the Cape flora, the forests and the Karoo], Scientific results of the German Deep Sea Expedition ‘Waldivia’,
1898–1899 2, T. 3, Fischer, Jena.
Milton, S.J., Yeaton, R.I., Dean, W.R.J. & Vlok, J.H.J., 1997, ‘Succulent Karoo’, in R.M. Cowling, D.M. Richardson & S.M. Pierce (eds.),
Vegetation of southern Africa, pp. 99−129, Cambridge University Press, Cambridge.
Mouillot, D. & Leprêtre, A., 1999, ‘A comparison of species diversity estimators’, Research on Population Ecology 41, 203−215.
Mucina, L., Jürgens, N., Le Roux, A., Rutherford, M.C., Schmiedel, U., Esler, K.J., Powrie, L.W., Desmet, P.G. & Milton, S.J., 2006, ‘Succulent
Karoo biome’, in L. Mucina & M.C. Rutherford (eds.), The vegetation of South Africa, Lesotho and Swaziland, pp. 220−299, South African
National Biodiversity Institute, Pretoria.
Mucina, L. & Rutherford, M.C. (eds.), 2006, The vegetation of South Africa, Lesotho and Swaziland, South African National Biodiversity Institute, Pretoria.
Mucina, L., Rutherford, M.C. & Powrie, L.W. (eds.), 2005, Vegetation map of South Africa, Lesotho and Swaziland, 1:1 000 000 scale sheet maps,
South African National Biodiversity Institute, Pretoria.
Myers, N., Mittermeier, R.A., Mittermeier, C.G., Da Fonseca, G.A.B. & Kent, J., 2000, ‘Biodiversity hotspots for conservation priorities’,
Nature 403, 835–858. doi:10.1038/35002501,
PMid:10706275
Podani, J., 2001, SYN-TAX 2000 Computer programs for data analysis in ecology and systematics, Scientia Publishing, Budapest.
Pressey, R.L., Cowling, R.M. & Rouget, M., 2003, ‘Formulating conservation targets for biodiversity pattern and process in the Cape Floristic Region,
South Africa’, Biological Conservation 112, 99–127.
doi:10.1016/S0006-3207(02)00424-X
Procheş, Ş., Cowling, R.M. & Mucina, L., 2003, ‘Species-area curves based on relevé data for the Cape Floristic Region’,
South African Journal of Science 99, 74−476.
Richardson, D.M., Cowling, R.M., Bond, W.J., Stock, W.D. & Davis, G.W., 1995, ‘Links between biodiversity and ecosystem function in the Cape Floristic
Region’, in G.W. Davis & D.M. Richardson (eds.), Mediterranean-type ecosystems: The function of biodiversity, pp. 285−333, Springer-Verlag,
Berlin.
Rouget, M., 2003, ‘Measuring conservation value at fine and broad scales: implications for a diverse and fragmented region, the Agulhas Plain’,
Biological Conservation 112, 217–232.
doi:10.1016/S0006-3207(02)00415-9
Rutherford, M.C. & Westfall, R.H., 1994, ‘Biomes of Southern Africa. An objective characterisation’, Memoirs of the Botanical Survey of
South Africa 63, 1−94.
Schmiedel, U., Dengler, J., Luther-Mosebach, J., Gröngröft, A., Muche, G., Petersen, A., Strohbach, B.J. & Jürgens, N., 2010,
‘Patterns and dynamics of vascular plant diversity along the BIOTA transects in southern Africa’, in U. Schmiedel & N. Jürgens (eds.),
Biodiversity in southern Africa. Volume 2: Patterns and processes at regional scale, pp. 118–135, Klaus Hess, Göttingen.
Schulze, R.E., 1997, South African Atlas of Agrohydrology and – Climatology, Water Research Commission, Pretoria.
Scott, J.M., Csuti, B., Jacobi, J.D. & Estes, J.E., 1987, ‘Species richness: A geographical approach to protecting future biological diversity’,
BioScience 37, 782–788. doi:10.2307/1310544
Shmida, A., 1984, ‘Whittaker’s plant diversity sampling method’, Israel Journal of Botany 33, 41−46.
Tilman, D., Bond, W.J., Campbell, B.M., Kruger, F.J., Linder, H.P., Scholz, A., Taylor, H.C. & Witter, M., 1983, ‘Origin and maintenance of plant
species diversity’, in J.D. Day (ed.), Mineral nutrients in Mediterranean ecosystems, Council for Scientific and Industrial Research, Pretoria
(South African National Scientific Programmes; Report no. 71).
Van der Merwe, H., 2009, ‘Patterns of plant diversity in the Hantam-Tanqua-Roggeveld subregion of the Succulent Karoo, South Africa’, PhD thesis,
Dept. of Plant Science, University of Pretoria.
Van der Merwe, H., Van Rooyen, M.W. & Van Rooyen, N., 2008a, ‘Vegetation of the Hantam-Tanqua-Roggeveld subregion, South Africa. Part 1. Fynbos Biome
related vegetation’, Koedoe 50, 61−71.
Van der Merwe, H., Van Rooyen, M.W. & Van Rooyen, N., 2008b, ‘Vegetation of the Hantam-Tanqua-Roggeveld subregion, South Africa. Part 2. Succulent
Karoo Biome related vegetation’, Koedoe, 50, 160−183.
Van der Merwe, H. & Van Rooyen, M.W., 2011a, ‘Life form spectra in the Hantam-Tanqua-Roggeveld, South Africa’, South African Journal of
Botany 77, 371–380. doi:10.1016/j.sajb.2010.10.002
Van der Merwe, H. & Van Rooyen, M.W., 2011b, ‘Species–area relationships in the Hantam-Tanqua-Roggeveld, Succulent Karoo, South Africa’,
Biodiversity and Conservation 20(6), 1183–1201.
doi:10.1007/s10531-011-0022-3
Van Wyk, A.E. & Smith, G.F. (eds.), 2001, Regions of floristic endemism in southern Africa: A review with emphasis on succulents, Umdaus Press, Pretoria.
Visconti, P., Pressey, R.L., Segan, D.B. & Wintle, B.A., 2010, ‘Conservation planning with dynamic threats: the role of spatial design and priority
setting for species’ persistence’, Biological Conservation 143, 756–767.
doi:10.1016/j.biocon.2009.12.018
Weather Bureau, 1998, Climate of South Africa. Climate statistics up to 1990, WB 42, Government Printer, Pretoria.
Weimarck, H., 1941, ‘Phytogeographical groups, centres and intervals within the Cape flora’, Lunds Universitets Årsskrif Avd. 2(37),
1−143.
Whittaker, R.J., Willis, K.J. & Field, R., 2001, ‘Scale and species richness: towards a general, hierarchical theory of species diversity’,
Journal of Biogeography 28, 453−470. doi:10.1046/j.1365-2699.2001.00563.x
Wilsey, B.J. & Potvin, C., 2000, ‘Biodiversity and ecosystem functioning: importance of species evenness in an old field’, Ecology 81,
887−892. doi:10.1890/0012-9658(2000)081[0887:BAEFIO]2.0.CO;2
|
|
