|
Article Information
|
Authors:
Judith M. Kruger1
Sandra MacFadyen1
Affiliations:
1South African National Parks, Skukuza, South Africa
Correspondence to:
Judith Kruger
Email:
judith.botha@sanparks.org
Postal address:
PO Box 178, Skukuza 1350, South Africa
Dates:
Received: 21 June 2010
Accepted: 08 Mar. 2011
Published: 13 May 2011
How to cite this article:
Kruger, J.M. & MacFadyen, S., 2011, ‘Science support within the South African National Parks
adaptive management framework’, Koedoe 53(2), Art. #1010, 7 pages.
doi:10.4102/koedoe.v53i2.1010
Copyright Notice:
© 2011. The Authors. Licensee: OpenJournals Publishing. This work
is licensed under the Creative Commons Attribution License.
ISSN:
0075-6458 (print)
ISSN:
2071-0791 (online)
|
|
|
|
Science support within the South African National Parks adaptive management framework
|
|
In This Essay...
|
Open Access
|
• Abstract
• Introduction
• SANParks science support process
• Data collection
• Data storage and documentation
• Data dissemination and sharing
• Data analysis
• Conclusion
• Acknowledgements
• References
|
|
‘Behind all good science is good science support.’ Implementing a successful strategic adaptive management (SAM)
framework requires an effective science support structure. This structure must be effective in all areas of data management,
starting with data collection and ending with the dissemination of knowledge, to facilitate timeous management decisions and
associated actions. Accordingly, South African National Parks has embraced the use of various technologies to enable the effective
implementation of a functional support structure. This paper described these technologies and discussed how they benefit the
implementation of the SAM framework.
Conservation implications: The importance of functional support structures in science and conservation management is frequently
undervalued in a system where emphasis is placed on scientific products. In order to promote research and facilitate analysis, sound
data management practices are essential to integrating knowledge into an organisation’s institutional memory.
South African National Parks’ (SANParks) network of 19 protected areas traverse extensive environmental gradients and biodiversity
and are exposed to ever-changing and intensifying global population pressure (Balmford et al. 2001). In response, SANParks has adopted
an adaptive management approach to biodiversity conservation. This style of management recognises the heterogeneous nature of ecological
systems (Pickett, Cadenasso & Benning 2003) by ensuring management actions are spatially dynamic over time. If scientists and managers
do not adapt and learn from their management actions, conservation will fail, to the detriment of the species and ecosystems being protected.
Moreover, if adaptive management is to be effective in SANParks, science support structures must be in place to sustain the research needed
to assess the outcomes of monitoring and management interventions. These structures should be aimed at capturing the learning that
individuals develop, and integrating it into the collective or institutional memory of the group (Salafsky, Margoluis & Redford 2001).
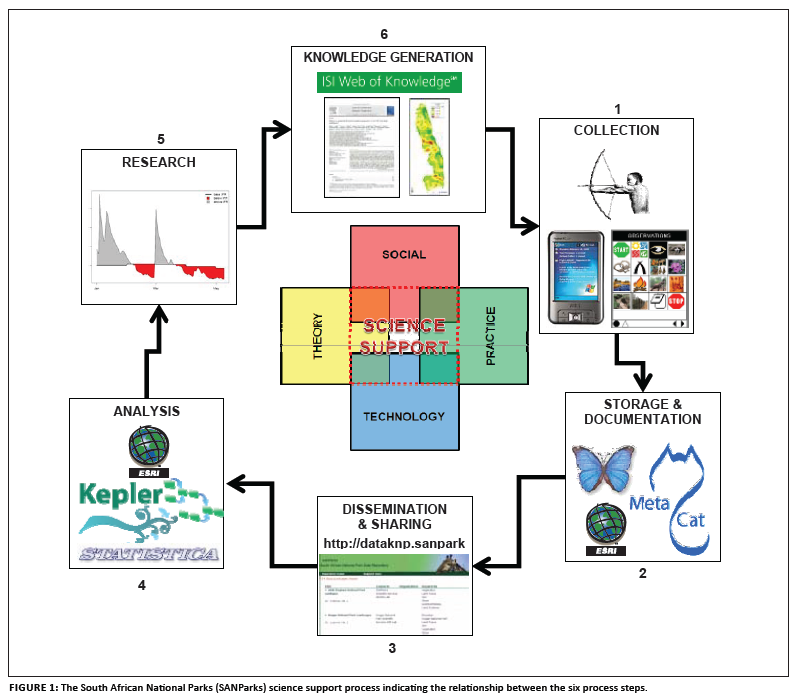
The process of science support (Figure 1) is rooted in the development of systems for storing, organising and accessing information. This
process includes, (1) the ongoing collection of new data, (2) the storage and documentation of data, (3) the dissemination and sharing of
data, (4) data analysis, (5) further research and (6) the promotion of knowledge generation. The ideal result is a distributed network
centre with data structures and standards in place to allow scientists and managers to apply and adjust management strategies appropriately
(Louisiana Protection and Restoration 2009). However, SANParks represents a diverse range of ecosystems, which is mirrored by the diversity
of environmental data that must be collected to facilitate research in SANParks. As a result, data collection methods must be dynamic as they
may include large ranges of biotic and abiotic variables, which could produce vast and heterogeneous datasets. Not surprisingly, it has proven
difficult to build data management and analytical systems to accommodate these data in general (Jones et al. 2006). Traditionally,
each type of data is stored in customised databases that are not connected to one another, so the data are largely inaccessible for cross-
cutting analysis and modelling.
 |
FIGURE 1: The South African National Parks (SANParks) science support process indicating the relationship between the six process steps.
|
|
In the case of SANParks’ thresholds of potential concern (TPCs; see Roux & Foxcroft 2011), which form an integral part of the
strategic adaptive management (SAM) framework, a number of different datasets are required for individual analyses. For this reason,
creating a streamlined system of data collection, analysis, presentation of results and knowledge feedback, will ensure timeous and
accurate outputs. In addition to maintaining this technology, organisations also need to develop human capital and institutional memory
to ensure continuity in the event that a key individual leaves the organisation. In most cases, people are the primary driving forces
behind change or the adoption of new technology within an organisation. If one or more of these drivers, or change agents, disappear
from the system, the programmes previously under their supervision may be at risk of collapse if the proper structures are not in place
to absorb the impact. We describe each step of the science support process in Figure 1, indicating the innovations and experience to be
gained from it.
|
SANParks science support process
|
|
Data collection
SANParks has a wide variety of data that must be collected to monitor the state of the environment successfully. To ensure the accuracy of the
data is preserved and the collection process standardised, a hand-held computer application (CyberTracker) is customised for each
monitoring programme. This icon-based system allows both literate and nonliterate field workers to record observations, with latitude and
longitude coordinates, using a personal digital assistant (PDA) device that features an integrated global positioning system (GPS). In this
way, data collected in the field are simultaneously captured electronically using graphic check lists, which enhance data accuracy.
The CyberTracker’s icon-based system also allows computer illiterate field workers to record data with minimal training,
thereby enhancing organisational skills development and capacity building. As a result, this data collection process can enable field
rangers to contribute directly to the management and research of each park by simply collecting basic environmental data during their
regular daily patrols (e.g. distribution of rare and endangered species, availability of surface water and disease outbreaks). In addition,
the integrated GPS ensures that separate GPS skills are not necessary to record latitude and longitude coordinates of each observation,
whilst the moving map functionality allows the user to pinpoint his position on a 1:50 000 or 1:250 000 topographical map or aerial
photograph at any time (see MacFadyen 2007 for operational details).
The value of the CyberTracker system was first recognised by Mr Douw (‘Swannie’) Swanepoel in 2000, when 44 Palm
IIIe organisers and 44 Garmin 12XL GPS devices interfaced via a cable were purchased for the Kruger National Park (KNP). In
2003, a further 120 Handspring Visor Deluxe PDAs with integrated Magellan GPS companions were purchased. As a result, each
of the 22 management sections in the KNP were issued with five PDAs for deployment with field rangers and five additional PDAs were
issued to the Scientific Services Division in Skukuza for various research projects. Since then, collective fundraising initiatives have
raised over R200 000.00 and enabled SANParks to purchase new Pocket PCs (with integrated GPS) for many other parks.
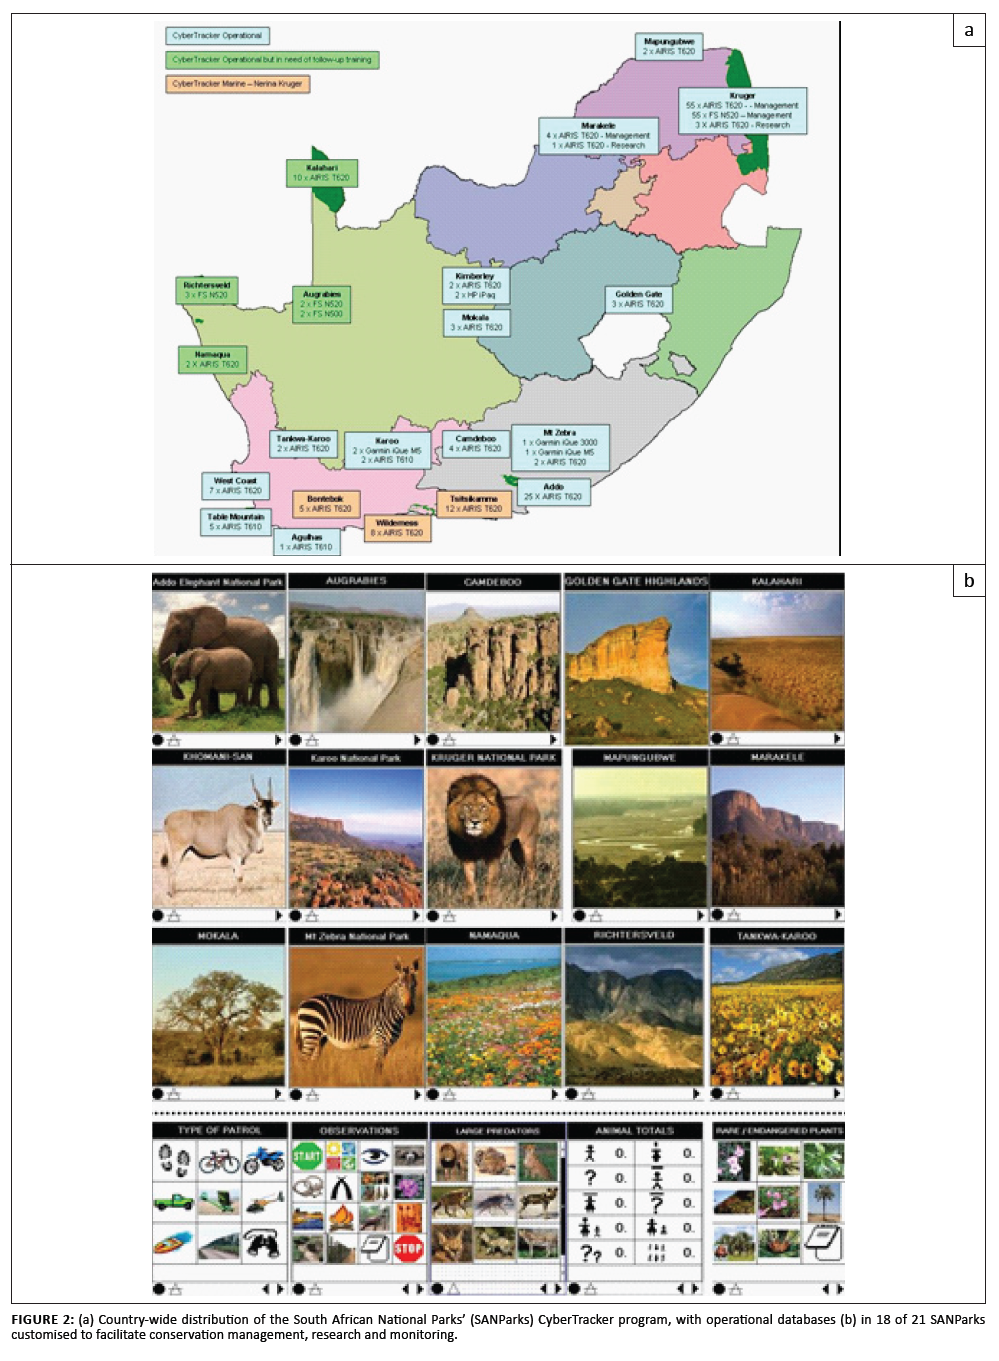
As a result, CyberTracker is operational in all South African national parks (Figure 2a). Established databases include ranger
patrols, vegetation condition assessments, animal behaviour monitoring, rare and endangered species listings, and invasive species
distribution mapping. Each database has been customised to facilitate conservation management, research and monitoring (Figure 2b).
The largest of these databases is the ranger patrol system, which is managed by a network of section rangers and operated by a core
of field rangers across all parks. The system is customised in-house with an icon-based interface that features English and local
language descriptions (e.g. Shangaan) for the collection of daily patrol information and basic environmental data. According to MacFadyen
(2009), the information gathered during these ranger patrols is used by SANParks management to:
• plan section patrols for area-integrity mapping
• provide an early warning system for disease outbreaks
• identify trends in illegal exit and entry points
• enable the detection and control of invasive alien species
• report fence-breaks to the State Veterinary Department for animal health purposes.
 |
FIGURE 2: (a) Country-wide distribution of the South African National Parks’ (SANParks) CyberTracker program, with operational databases (b) in 18 of 21 SANParks customised to facilitate conservation management, research and monitoring.
|
|
In addition, the programme supports local community projects such as the Xilongana Craft Programme in the Thulamahashe region, which
designs and produces protective canvas cases for the Pocket PCs. In general, the ranger patrol system aims to enhance park-specific
environmental management and research through field monitoring (see MacFadyen 2007 for more detail about the SANParks CyberTracker
program).
Scientists use the collected data to facilitate research and assist in making informed management decisions regarding rare species
monitoring (Endangered Wildlife Trust 2011; Murn 2009), invasive species research (Dietemann, Lubbe & Crewe 2006; Foxcroft
et al. 2009; Foxcroft et al. 2010; Hui et al. 2011), fire mapping, archaeological inventorying, species distribution
mapping, ecosystem interactions (Burkepile et al. 2008; Somers & Hayward 2009), and veterinary–wildlife interfaces
(Brahmbhatt et al. in press; Ferguson & Hanks 2010; Jori et al. 2009).
Data storage and documentation
Once data has been collected it needs to be correctly archived and, more importantly, clearly documented in order to maintain its
long-term usability. SANParks uses a flexible, structured metadata standard called Ecological Metadata Language (EML), which is a
metadata standard developed by the ecological community in the USA (Fegraus et al. 2005). EML was developed to address the
lack of dataset documentation and to provide structure to traditionally unstructured information (i.e. tabular data with no metadata;
Michener et al. 1997). The EML standard evolved by incorporating various elements from other metadata language standards and is
supported by a wide range of users ensuring continual improvement. As the EML structure is modular and easily extensible it can be used
for the documentation of both metadata and datasets in a number of different data formats. EML requires multiple levels of documentation
to be specified.
The first level includes dataset identification, which is documented in the title, abstract and keyword fields. The next level, known
as the discovery level, includes information on both the geographic extent and the temporal coverage of the datasets. The geographic
extent is captured with spatial coordinates that can then be used to plot coordinates on a map. Applications can leverage both the
geographical and date–time fields for dataset discovery. The evaluation level metadata includes information about the methods
used, as well as the project level information. These methods indicate how the data was collected and may be described as a set of
hierarchical processes with substeps.
The third level contains access information, which indicates who may change and read the data and metadata. Furthermore, this information
also describes where the data can be obtained and the required data format. The final level is the logical model information that describes
the structure of data tables and their variables. Each variable requires a name, description and a measurement type to be captured. Once the
EML has been created for a particular data package, which includes the metadata and the data tables, it can be uploaded into a data repository
where it can be browsed, downloaded and archived. The Knowledge Network for Biocomplexity (KNB; http://knb.ecoinformatics.org/index.jsp) now
has 16 partner organisations who contribute EML data and metadata to a global data repository, including SANParks. An added advantage of
being a part of this global network is the replication of data between sites, which reduces the risk of data loss. The access rules do not
change with replication, which means that the dataset owner can still determine who is allowed to access the data without needing to be
concerned that the information will be amended once replication occurs.
Collating accurate metadata about heterogeneous datasets can be time consuming and therefore difficult without supporting software tools.
As a result, SANParks adopted the free software product Morpho (Higgins, Berkley & Jones 2002) to create EML metadata to be
uploaded into the SANParks data repository (http://dataknp.sanparks.org/sanparks).
Morpho creates EML using a wizard front end for
the simpler metadata, with an EML tree for the more complex metadata. Morpho is then used to upload the data
to the SANParks data repository, which can then be searched through a web interface. An extension to this system allows spatial layers,
with standard Federal Geographic Data Committee metadata created through ArcGIS, to be incorporated into the repository. This
additional functionality allows searches for spatial and nonspatial data simultaneously.
Data dissemination and sharing
Following the capture of data (and associated metadata) in the data repository, software tools can be automated to access this
information and perform various analyses. The network of data repositories allows users to search for data from any of the
participating sites using keywords or localities of interest
(http://dataknp.sanparks.org/sanparks).
This promotes integration of global ecological data and allows for collaboration across scales, as well as transcontinental analysis.
Data analysis
Although data can be searched and shared across all sites globally, as indicated earlier, data stored in the SANParks database are
used in standardised routine analyses to assess whether the thresholds of specific ecological variables have been exceeded. These
thresholds provide upper and lower limits of acceptable change in specific ecological indicators (Roux & Foxcroft 2011). The TPCs
are therefore developed to provide early warning signs of impending unacceptable changes. For example, one of the key concerns and
focus areas for TPC development has been on river management (for a full treatise see McLoughlin et al. 2011 and Pollard, Du
Toit & Biggs 2011). Excessive abstraction of water upstream of the KNP has lowered flow volumes below, inhibiting the functional
processes of the river ecosystems. These thresholds, or in-stream flow requirements (IFR), have been determined for all perennial
rivers. The monitoring data is analysed for each river in order to determine whether these thresholds (IFRs) have been exceeded.
To accomplish these kinds of cross-scale and cross-disciplinary analyses, an analytical tool is required which can interface with a
variety of data sources and provide access to commonly used analytical tools. One such approach is to use a scientific workflow system,
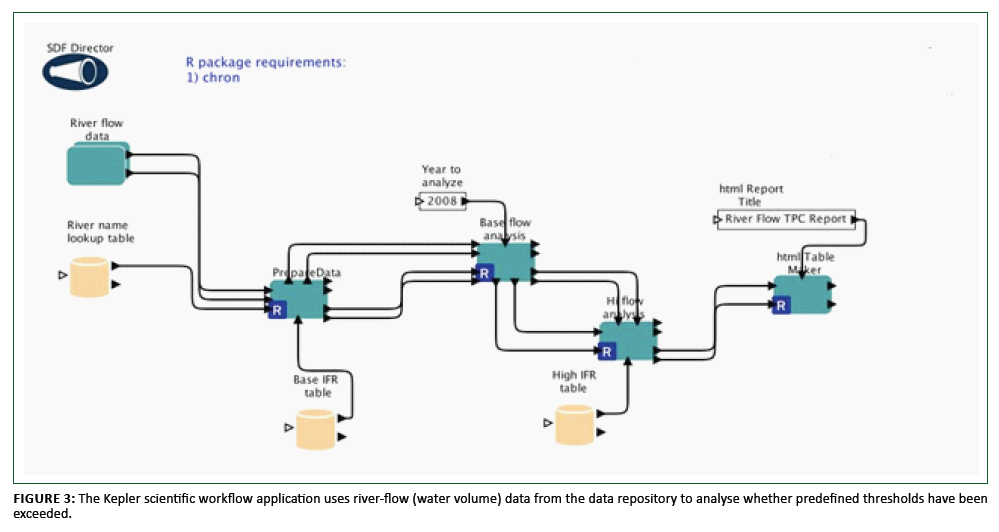
such as Kepler (Ludäscher et al. 2006), to orchestrate the analysis (Figure 3). Scientific workflows in general and
Kepler, in particular, have the capability to access multiple analytical systems such as R and Matlab, as well
as other statistical and modelling systems. Each workflow can consist of a series of analytical steps, starting from data cleaning
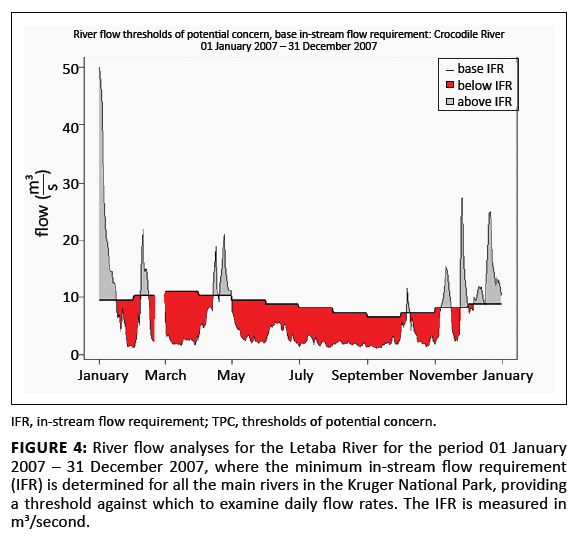
and concluding with complex analytical procedures to produce reports and visual outputs. For example, Figure 4 shows the results of
the river-flow analysis, indicating periods when the threshold was exceeded (i.e. where river flow was below minimum requirements,
indicated in red).
 |
FIGURE 3: The Kepler scientific workflow application uses river-flow (water volume) data from the data repository to analyse whether predefined thresholds have been exceeded.
|
|
 |
FIGURE 4: River flow analyses for the Letaba River for the period 01 January
2007 – 31 December 2007, where the minimum in-stream flow requirement
(IFR) is determined for all the main rivers in the Kruger National Park, providing
a threshold against which to examine daily flow rates. The IFR is measured in
m3/second.
|
|
Using a workflow approach brings with it a number of advantages. Firstly, it enables users to determine clearly the dataset version
used for a particular analysis, thereby reducing errors. This allows analyses to be rerun on various versions of the datasets. Secondly,
the workflow procedure and the analytical outputs can also be uploaded to the data repository, allowing the same workflow procedure to
be rerun later and the outputs archived. SANParks has adopted Kepler to analyse the data collected through routine monitoring
programmes (Figure 3) and thus detect any breaches of the TPCs.
However, park managers need these analyses to be run on a regular basis to enable rapid decision making. Additionally, the reports and
figures generated by the analyses need to be shared broadly with a variety of management stakeholders. As such, development has begun
on a web-based execution and reporting system that will make all outputs broadly accessible to the necessary stakeholders.
Adaptive management is a systematic, rigorous and scientifically defensible approach to learning based on outcomes of management
actions (Walters & Holling 1990). Strategic adaptive management, as practiced in SANParks, is more pragmatic and goal-orientated
and is reliant on an effective science and management partnership (Rogers 1998). As a result, the criteria for the success of SAM
include both biological and social measures, encompassing learning and the application of new knowledge (Kleiman et al. 2000).
However, a gap exists at both the social and technological levels of SAM, including institutionalisation and implementation (Coleman
et al. 2010; Rogers 1998). Although adaptive management practices should include the documentation of the research processes
followed and the results achieved, on which management decisions can be based, a technological divide often prevents competent data
management. The science support tools we described here aim to harness current developments in technology to facilitate the implementation
of the adaptive management process.
We would like to acknowledge Mr Douw (‘Swannie’) Swanepoel posthumously for introducing the CyberTracker
program to SANParks and for his unyielding dedication to the KNP and conservation in general. We would further like to acknowledge the
support of various funders who have supported the SANParks CyberTracker program over the years, namely, Deutsche Gesellschaft
für Internationale Zusammenarbeit, Sappi Limited, Mrs Erna Goodwin estate, Thubelisha Homes, Richtersveld Poverty Relief Unit,
UNITRANS, MEDSCHEME, West Rand Honorary Rangers, SANParks forum moderators and members
(http://www.sanparks.org/forums/), and over
50 members of the general public
(http://www.sanparks.org/parks/kruger/conservation/scientific/ donations/cybertracker). Finally,
we would like to acknowledge the staff at the National Centre for Ecological Analysis and Synthesis for development and implementation
of these tools, as well as the A.W. Mellon Foundation for funding.
Balmford, A., Moore, J.L., Brooks, T., Burgess, N., Hansen, L.A., Williams, P., et al., 2001, ‘Conservation conflicts
across Africa’, Science 291, 2616−2619.
doi:10.1126/science.291.5513.2616,
PMid:1128337
Brahmbhatt, D.P., Fosgate, G.T., Dyason, E., Budke, C., Gummow, B., Jori, F., et al., in press, ‘Contacts between
domestic livestock and wildlife at the Kruger National Park Interface of the Republic of South Africa’, Preventive
Veterinary Medicine.
Burkepile, D., Smith, M.D., Fynn, R.W.S. & Knapp, A.K., 2008, ‘Interactions between herbivore size and fire regime on plant
community structure’, in South African National Parks (eds.), Reports on scientific research projects undertaken in the
savanna parks of the South African National Parks during 2008. Project Reports KNP 15/1/2–2008, p. 23, SANParks, Pretoria.
Coleman, A.M., Wigmosta, M.S., Lane, L.J., Tagestad, J.D. & Roberts, D., 2010, ‘GIS-based adaptive management decision support
system to develop a multi-objective framework: A case study utilizing GIS technologies and physically-based models to achieve improved
decision making for site management’, Journal of Map and Geography Libraries 4(2), 269−284.
Dietemann, V., Lubbe, A. & Crewe, R.M., 2006, ‘Human factors facilitating the spread of a parasitic honeybee in South Africa’,
Journal of Economical Entomology 99, 7−13.
doi:10.1603/0022-0493(2006)099[0007:HFFTSO]2.0.CO;2
Endangered Wildlife Trust, 2011, ‘The Endangered Wildlife Trust: Birds of prey programme. Registered SANParks research project’,
viewed 04 February 2011, from
https://www.ewt.org.za/WHATWEDO/OurProgrammes/BirdsofPreyProgramme.aspx
Fegraus, E., Andelman, S.J., Jones, M.B. & Schildhauer, M., 2005, ‘Maximizing the value of ecological data with structured metadata:
An introduction to Ecological Metadata Language (EML) and principles for metadata creation’, Bulletin of the Ecological Society of
America 86(3), 158−168.
doi:10.1890/0012-9623(2005)86[158:MTVOED]2.0.CO;2
Ferguson, K. & Hanks, J. (eds.), 2010, ‘Fencing impacts: A review of the environmental, social and economic impacts of game and
veterinary fencing in Africa with particular reference to the Great Limpopo and Kavango-Zambezi Transfrontier Conservation Areas’,
Mammal Research Institute, Pretoria, viewed 04 February 2011, from
http://www.wcs-ahead.org/gltfca_grants/grants.html
Foxcroft, L.C., Richardson, D.M., Rouget, M. & MacFadyen, S., 2009, ‘Patterns of alien plant distribution at multiple spatial scales
in a large national park: Implications for ecology, management and monitoring’, Diversity and Distributions 15, 367−378.
doi:10.1111/j.1472-4642.2008.00544.x
Foxcroft, L.C., Jarošík, V., Pyšek, P., Richardson, D.M. & Rouget, M., 2010, ‘Protected area boundaries as a natural
filter of plant invasions from surrounding landscapes’, Conservation Biology 25(2), 400–405.
doi:10.1111/j.1523-1739.2010.01617.x
Higgins, D., Berkley, C. & Jones, M.B., 2002, ‘Managing heterogeneous ecological data using Morpho’, in J. Kennedy (ed.),
Proceedings of the 14th International Conference on Scientific and Statistical Database Management, Washington DC, USA, July
24–26, 2002.
Hui, C., Foxcroft, L.C., Richardson, D.M. & MacFadyen, S., 2011, ‘Defining optimal sampling effort for large-scale monitoring of
invasive alien plants: A Bayesian method for estimating abundance and distribution’, Journal of Applied Ecology, viewed n.d., from
http://onlinelibrary.wiley.com/doi/10.1111/j.1365-2664.2011.01974.x/abstract,
doi:10.1111/j.1365-2664.2011.01974.x
Jones, M.B., Schildhauer, M., Reichman, O.J. & Bowers, S., 2006, ‘The new bioinformatics: Integrating ecological data from the gene
to the biosphere’, Annual Review of Ecology, Evolution, and Systematics 37, 519−544.
doi:10.1146/annurev.ecolsys.37.091305.110031
Jori, F., Vosloo, W., Du Plessis, B., Bengis, R., Brahmbatt, D., Gummow, B., et al., 2009, ‘A qualitative risk assessment of
factors contributing to foot and mouth disease outbreaks on the Western Boundary of Kruger National Park’, Revue Scientifique et
Technique OIE 28(3), 917−933.
Kleiman, D.G., Reading, R.P., Miller, B.J., Clark, T.W., Scott, J.M., Robinson, J., et al., 2000, ‘Improving the evaluation of
conservation programs’, Conservation Biology 14(2), 356−365.
doi:10.1046/j.1523-1739.2000.98553.x
Louisiana Protection and Restoration, 2009, ‘Final technical report: Adaptive management appendix’, LACPR, US Army Corps of
Engineers, New Orleans District, Mississippi Valley Division, New Orleans, pp. 1−14, viewed n.d., from
http://lacpr.usace.army.mil/default.aspx?p=s&t=15&i=27
Ludäscher, B., Altintas, I., Berkley, C., Higgins, D., Jaeger-Frank, E., Jones, M., et al., 2006, ‘Scientific workflow
management and the Kepler System’, Workflow in Grid Systems. Concurrency and Computation: Practice & Experience
18(10, Special Issue), 1039−1065.
MacFadyen, S., 2007, ‘CyberTracker: Conservation in the palm of our hands’, viewed 04 February 2011, from
http://www.sanparks.org/parks/kruger/conservation/scientific/gis/CyberTracker_Poster.pdf
MacFadyen, S., 2009, ‘South African National Parks CyberTracker Programme’, viewed 04 February 2011, from
http://www.sanparks.org/parks/kruger/conservation/scientific/gis/cybertracker.php
Matlab, 2004, computer software, The MathWorks Inc., Natick.
McLoughlin, C.A., Deacon, D., Sithole, H. & Gyedu-Ababio, T., 2011, ‘History, rationale, and lessons learned: Thresholds of
potential concern in Kruger National Park river adaptive management’, Koedoe 53(2), Art. #996, 27 pages.
doi:10.4102/koedoe.v53i2.996
Michener, W.K., Brunt, J.W., Helly, J.J., Kirchner, T.B. & Stafford, S.G., 1997, ‘Non-geospatial metadata for the ecological
sciences’, Ecological Applications 7, 330−342.
doi:10.1890/1051-0761(1997)007[0330:NMFTES]2.0.CO;2
Murn, C., 2009, ‘Ecological characteristics of the White-headed Vulture Trigonoceps occipitalis’ in southern Africa, in
South African National Parks (eds.), Reports on scientific research projects undertaken in the savannah national parks of South African
National Parks during the year 2009 and projects that were completed during 2008. Research Project Reports 2009, KNP 15/1/2-2009,
p. 157, SANParks, Pretoria.
Pickett, S.T.A., Cadenasso, M.L. & Benning, T.L., 2003, ‘Biotic and abiotic variability as key determinants of savanna heterogeneity at
multiple spatiotemporal scales’, in J.T. du Toit, K.H. Rogers & H.C. Biggs (eds.), The Kruger experience: Ecology and management of
Savanna heterogeneity, pp. 22−40, Island Press, Washington DC.
Pollard, S., Du Toit, D. & Biggs, H.C., in press, ‘River management under transformation:The emergence of strategic adaptive
management of river systems in the Kruger National Park’, Koedoe.
R, version 2.9.0, 2009, computer software, The R Foundation for Statistical Computing, s.l.
Rogers, K., 1998, ‘Managing science/management partnerships: A challenge of adaptive management’, Conservation Ecology 2(2),
1−4.
Roux, D.J. & Foxcroft, L.C., 2011, ‘The development and application of strategic adaptive management within South African National
Parks’, Koedoe 53(2), Art. #1049, 5 pages.
doi:10.4102/koedoe.v53i2.1049
Salafsky, N., Margoluis, R. & Redford, K., 2001, ‘Adaptive management: A tool for conservation practitioners’,
Biodiversity Support Program, pp. 1−99, viewed n.d., from
http://www.rmportal.net/library/content/tools/biodiversity-conservation-tools/putting-conservation-in-context-cd/adaptive-management-resources/5-5-a.pdf
Salafsky, N., Margoluis, R., Redford, K.H. & Robinson, J.G., 2002, ‘Improving the practice of conservation: A conceptual framework
and research agenda for conservation ccience’, Conservation Biology 16(6), 1469−1479.
doi:10.1046/j.1523-1739.2002.01232.x
Somers, M. & Hayward, M., 2009, ‘Impact of climate change on predator prey preferences’, in South African National Parks
(eds.), Reports on scientific research projects undertaken in the savannah national parks of South African National Parks during
the year 2009 and projects that were completed during 2008. Research Project Reports 2009, KNP 15/1/2–2009, p. 215,
SANParks, Pretoria.
Walters, C.J. & Holling, C.S., 1990, ‘Large-scale management experiments and learning by doing’, Ecology 71(6),
2060−2068.
doi:10.2307/1938620
|
|